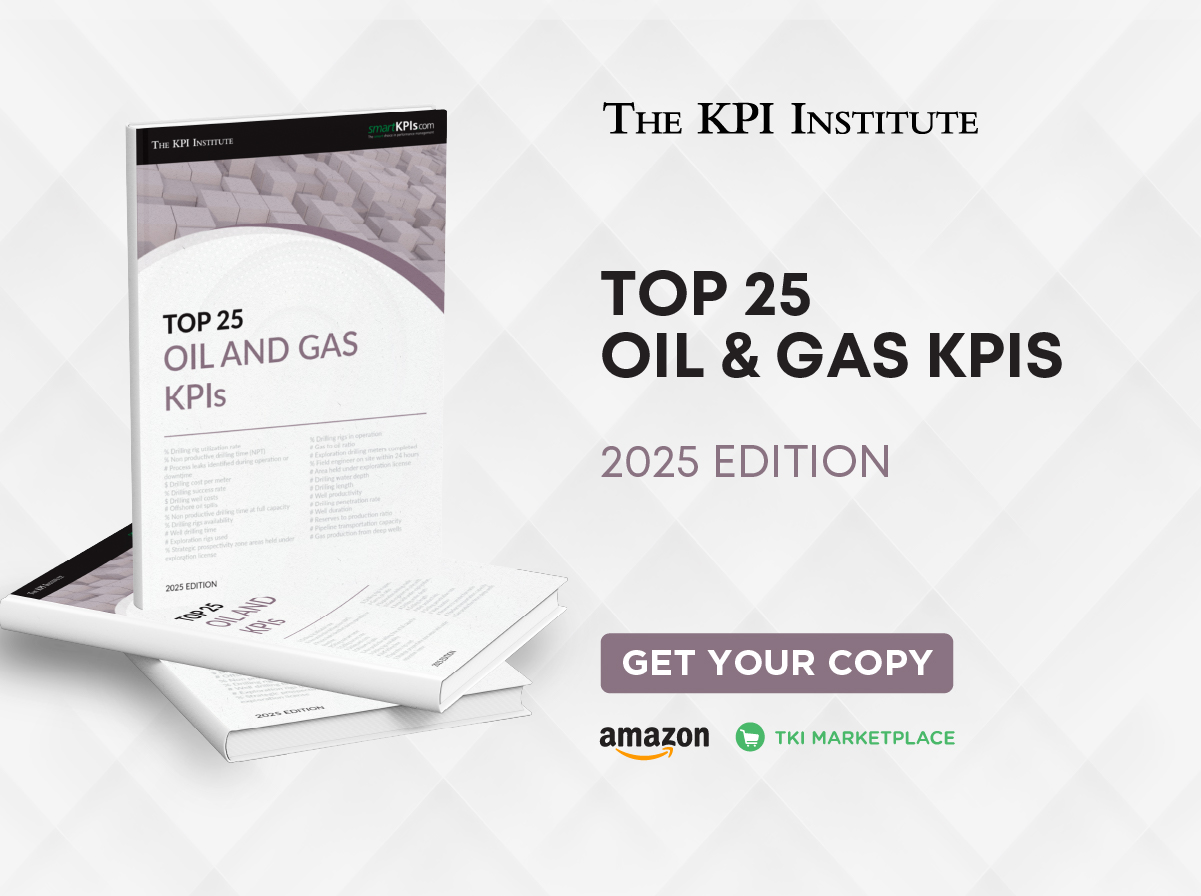
The Top 25 Oil and Gas KPIs Report has arrived: what’s inside the first edition of the 2025 series?
April 16th, 2025 Posted by Kimberly Tilar KPIs 0 thoughts on “The Top 25 Oil and Gas KPIs Report has arrived: what’s inside the first edition of the 2025 series?”
From powering vehicles on daily commutes to fueling airplanes across continents, from heating homes during cold seasons to generating electricity that lights up cities, oil and gas are deeply embedded in life. Even the production and transport of countless everyday items depend on these energy sources—we rely on them to keep the world moving and growing.
The oil and gas industry is one of the largest sectors in the world in terms of dollar value. According to IBISWorld, the industry generated an estimated $4.2 trillion in global revenue by the end of 2024. This reflects a compound annual growth rate (CAGR) of 6.0%, with a modest 1.9% increase recorded in 2024 alone.
This sustained growth reflects not only global energy demand but also the industry’s ongoing shift toward digital transformation. As oil and gas producers increasingly adopt advanced technologies like big data analytics and machine learning, the role of key performance indicators (KPIs) becomes even more vital. These innovations enhance exploration accuracy, boost production efficiency, reduce environmental impact, and generate vast performance data. Leveraging KPIs enables organizations to track these improvements, benchmark success, and make data-driven decisions that align with evolving energy demands and sustainability goals.
To support performance monitoring and strategic decision-making in the oil and gas industry, The KPI Institute has released the Top 25 Oil and Gas KPIs – 2025 Edition, the first report of the Top 25 KPIs series in 2025. This report combines the most relevant and widely used KPIs across the sector to offer valuable insights into operational efficiency, financial performance, safety, and sustainability. Whether for benchmarking, performance improvement, or aligning with industry best practices, the KPIs featured in this edition serve as essential tools for navigating the complexities of the oil and gas industry in 2025 and beyond.
What’s inside the report?
While the Top 25 KPIs series has been ongoing, this marks the first dedicated oil and gas edition since 2018, which presents refreshed content, updated metrics, and a more refined structure that reflects the evolution of our reporting approach over the years.
The Top 25 Oil and Gas KPIs – 2025 Edition report offers practical guidance on how KPIs can enhance clarity, focus, and overall performance. While they are a valuable starting point for identifying relevant KPIs, these reports are not intended as definitive solutions. Instead, they represent the most popular KPIs based on smartKPIs.com data and user engagement.
This report is designed for practitioners, academics, and consultants involved in performance management. It covers the basics of KPIs, such as explaining key terminology and their application across organizations to drive performance, highlighting KPIs’ role in the Performance Measurement Framework, and exploring the governance structures that will ensure effective management.
Furthermore, the report features an updated two-page KPI Documentation Form template, including refined fields based on The KPI Institute’s latest research. It also offers practical tips for KPI reporting and visual examples of scorecards and dashboards to support real-world applications.
For a quick overview, here are the top five KPIs from Top 25 Oil and Gas KPIs – 2025 Edition report:
- % Drilling rig utilization rate – Tracks the percentage of time an operational drilling rig is actively in use compared to the total time it is available for drilling activities.
- % Non productive drilling time (NPT) – Measures the percentage of time when drilling operations are halted or the penetration rate is significantly low, relative to the total production time.
- # Process leaks identified during operation or downtime – Quantifies the number of unintended substance releases from industrial equipment or systems during operational phases or scheduled downtime within the reporting period.
- $ Drilling cost per meter – Determines the average cost of drilling per meter or foot of well drilled.
- % Drilling success rate – Measures the percentage of exploration wells that successfully encountered oil and gas reserves, compared to the total number of exploration wells drilled
Now that you’ve had a glimpse of the top metrics, are you ready to take your performance to the next level? Explore the Top 25 Oil and Gas KPIs – 2025 Edition for a deeper dive into each featured KPI above, plus 20 more in the report. Unlock practical insights to enhance operations, boost efficiency, and stay ahead in a competitive industry. Download the full report today by visiting the TKI Marketplace. You can also purchase a physical copy via Amazon.
