Strategic planning and execution in a transformative era: highlights from the webinar
November 20th, 2024 Posted by Kimberly Tilar Webinar 0 thoughts on “Strategic planning and execution in a transformative era: highlights from the webinar”
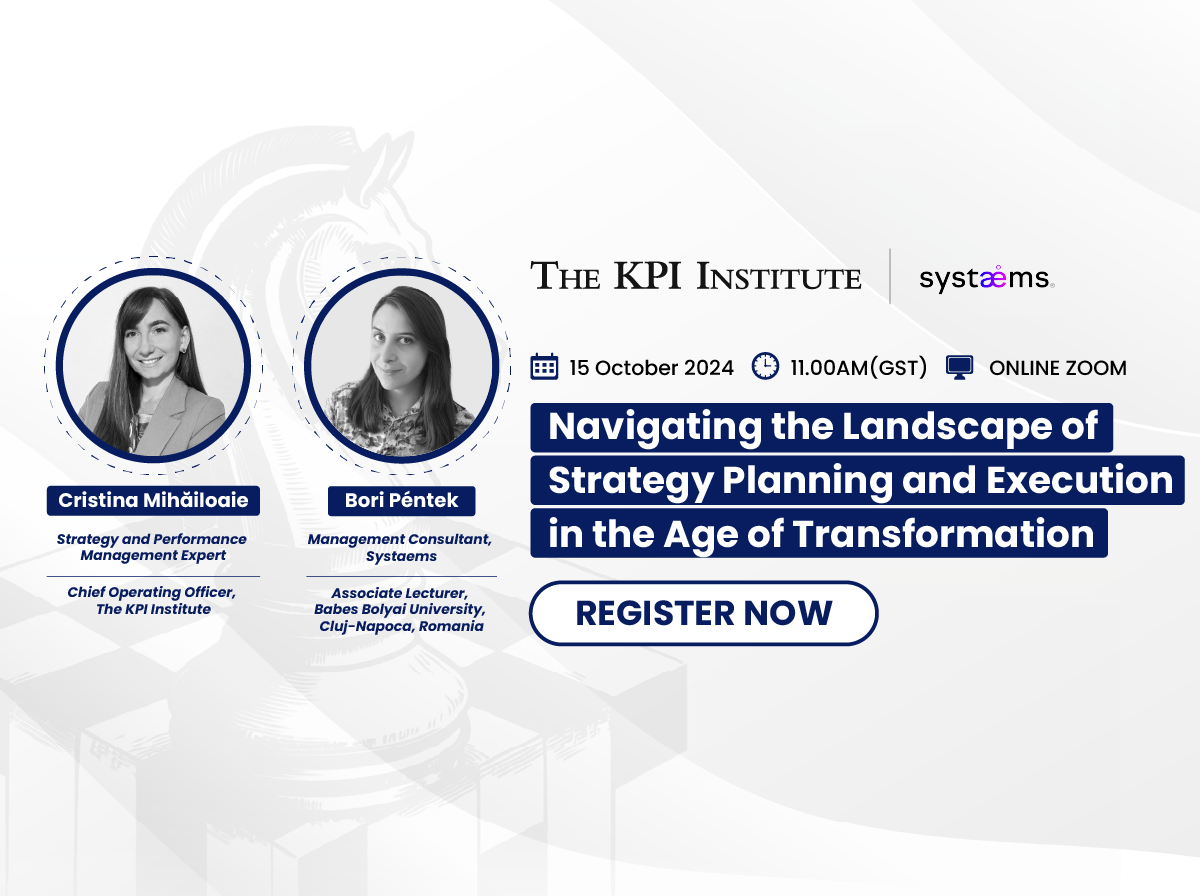
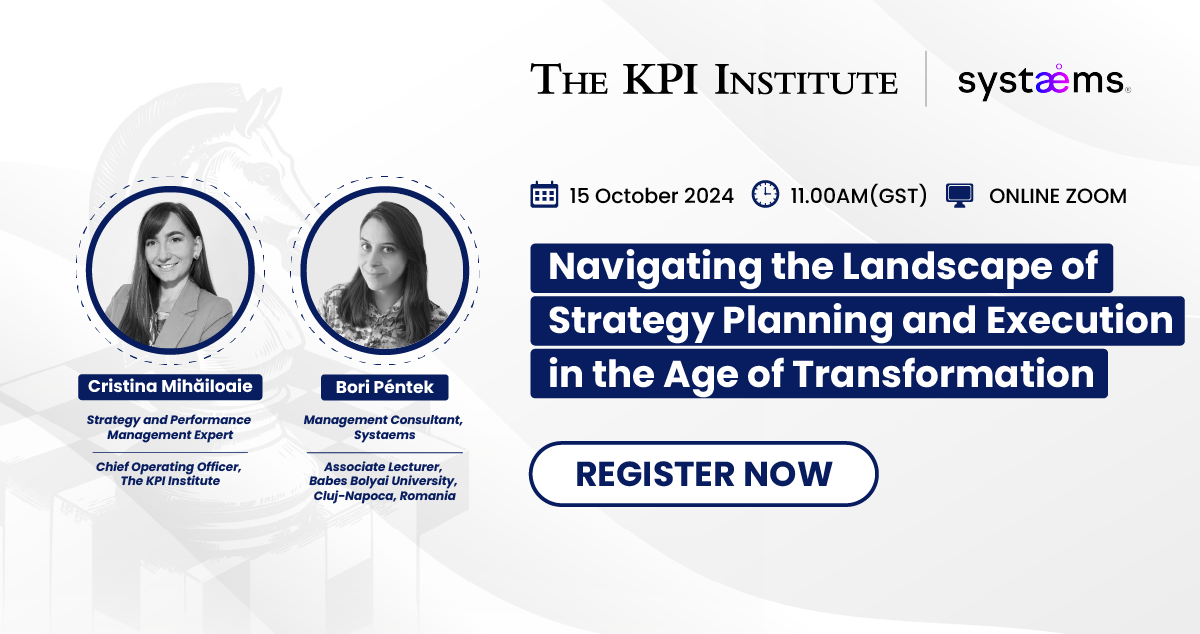
On October 15th, 2024, The KPI Institute hosted an exclusive webinar titled “Navigating the Landscape of Strategy Planning and Execution in the Age of Transformation,” which brought together industry leaders and professionals for an insightful discussion on the latest trends in strategy management.
During the session, The KPI Institute unveiled key findings from the State of Strategy Management Practice Report 2024, focusing on the unique challenges and opportunities faced by organizations in the Middle East and North Africa (MENA) region. The webinar provided an in-depth look at the evolving landscape of business planning, performance management systems, and the execution of strategic initiatives, which offer valuable insights for organizations looking to navigate the complexities of transformation in today’s dynamic business environment.
The session featured expert speakers from The KPI Institute and Systaems:
Cristina Mihăiloaie is a Strategy and Performance Management Expert and Chief Operating Officer at The KPI Institute. Her professional background centers on research, product development, and knowledge sharing within strategy and performance management. Over the past 12 years, she has played a key role in establishing best practices and standards for utilizing and maximizing key performance indicators (KPIs) in organizations disseminated through research publications, academic articles, and educational programs.
Bori Péntek is a Management Consultant at Systaems who specializes in organizational development and human resource management. She assists businesses in aligning their strategies, processes, and practices with their core values, prioritizing human and social well-being. With a background in recruitment, human resources, and operations management across various sectors, including sustainable construction, research, and education. She is an Associate Lecturer at Babes Bolyai University, Cluj-Napoca, Romania.
Webinar highlights
The webinar’s agenda centered on the key dilemmas organizations face in strategy planning, performance management, and execution, providing valuable insights into the challenges that often hinder effective strategy implementation.
Dilemma 01: Deliberate vs. Emergent Strategic Planning. The State of Strategy Management Practice – 2024 MENA Region report indicates that 76% of professionals claim to have formal and regular strategy planning and 56% of respondents review strategy annually or every 3 years. Given these statistics and Cristina’s experience as an advisor, she pointed out that the predominant practice in the MENA region is Deliberate Strategy Planning. Further to the discussion, Bori shared her perspective on why Deliberate Strategy Planning is complicated to achieve success, “Mostly it [Deliberate Strategy Planning] offers an illusion of stability that it is not there anymore in the external or internal environment. A lot of things have to work very well for the deliberate strategy to work.”
Dilemma 02: Balanced Scorecard System vs. Objectives and Key Results Frameworks. Since common challenges in working with KPIs for MENA organizations imply difficulties in selecting relevant KPIs, to ensure alignment and collect data, the discussion between our experts led to questioning if a particular framework is better suited to address these challenges. Bori outlined, “Irrespective of whether you use Balanced Scorecard (BSC) or Objectives and Key Results (OKRs), you’re going to have these challenges. It’s not about selecting one system and just going along with it. It’s about leveraging the strength of each system by thinking wisely about where they can be used.”
Dilemma 03: Success vs. Failure in Strategy Execution. Insights from the State of Strategy Management Practice – 2024 MENA Region report show that most respondents (42%) listed ineffective cross-functional collaboration as the top reason for strategy failure. It is followed by a lack of leadership support (40%), slow decision-making and approval 33%), and insufficient resources for projects to succeed (33%).
To address cross-functional collaboration, Cristina advised nurturing the right “rituals:” “Procedures become quickly obsolete, but rituals are what we do and how we do it, are the unwritten rules that govern the workplace. It’s not necessarily about the work procedure, it is more about how people come together and get things done.” She added that the rituals we want to build are to create multidisciplinary teams rather than work in silos, to have regular performance meetings and use KPIs to understand the business better, to challenge ourselves constructively, and to promote transparency and collaboration in problem-solving.
The webinar ended with a question-and-answer session where the featured speakers addressed questions about the link between strategy and culture, underestimated factors for strategy execution success, the risk of not aligning KPIs across the organization and many more. An extended Q&A document is currently being prepared for release with extremely interesting perspectives.
From key findings in the State of Strategy Management Practice Report 2024 to practical advice on overcoming obstacles in strategy management, the webinar provided valuable takeaways for organizations looking to stay ahead in today’s fast-paced business environment.
If you missed the live session, watch the full video of the webinar on The KPI Institute’s official YouTube channel. Click here to watch the webinar now!


