Posts in KPIs

On the right course: navigating strategy and performance with the Top 25 KPIs of 2025

May 14th, 2025 Posted by KPIs 0 thoughts on “On the right course: navigating strategy and performance with the Top 25 KPIs of 2025”

How do you navigate a ship when the weather is unpredictable and the map keeps changing?

That’s the dilemma that confronts most organizations today, where volatility, complexity, and perpetual change are the new normal. Under these conditions, successful strategy and performance management are no longer choices, but necessities. Business corporations are being asked to produce quantifiable results, react nimbly, and connect long-term vision to day-to-day action.

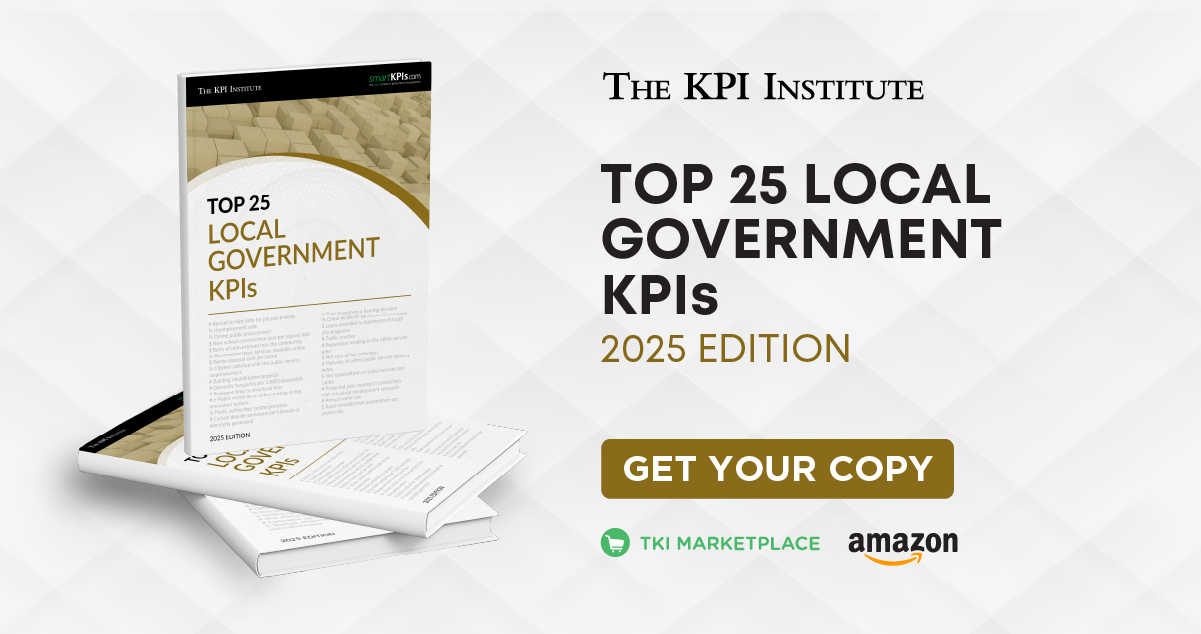
To assist professionals in dealing with such demands, The KPI Institute has published the Top 25 Strategy and Performance Management KPIs – 2025 Edition. The definitive report highlights the most effective key performance indicators (KPIs) through evidence-based usage data, empowering decision-makers with facts to fortify their performance architectures and achieve strategic success.

This edition is a part of the Top 25 KPIs – 2025 Edition report series authored by The KPI Institute. This provides new perspectives into implementation strategies of KPI and captures successful performance management practices in industry settings. Ranging across diverse indicators—beginning from Strategic Initiative Completion Rate to KPI Implementation Rate—the report depicts current usage trends developed through the dataset accumulated during the period from January 2023 through April 2024 using smartKPIs.com data.

The KPIs in this report are the most widely used metrics in strategy and performance management, offering practitioners a solid benchmark to measure and improve their existing measurement systems. For a quick overview, here are the top five out of the 25 KPIs from the report:

  1. # Performance Management Capability Maturity Level – Measures the complexity of an organization’s performance measurement function and its alignment with international best practices, based on the maturity assessment framework developed by the Global Performance Audit Unit and The KPI Institute.
  2. # Strategy Planning Capability Maturity Level – Assesses the complexity of the organization’s strategic planning function and its compliance with international best practices, using the maturity assessment framework developed by the Global Performance Audit Unit and The KPI Institute.
  3. % Performance reports produced on time – Tracks the percentage of performance reports submitted as originally scheduled, relative to the total number of reports planned for submission.
  4. # Operational performance reviews conducted – Evaluates how many formal assessments are carried out on operational processes, procedures, and outcomes during a specified period.
  5. % Active KPIs – Calculates the percentage of KPIs that are actively tracked and monitored, compared to the total number of KPIs selected.

KPIs are the backbone of contemporary performance management. They help organizations track progress, identify problems, and realize strategic objectives. As sectors change and complexity increases, having access to real-time, accurate KPI benchmarks enables organizations to stay flexible and up to speed.

The Top 25 Strategy and Performance Management KPIs – 2025 Edition offers In-depth articles, where you can discover new thought leadership articles that dive into the Performance Measurement Concept Framework, prevalent KPI use challenges, and 10 pragmatic tactics for more effective KPI implementation. It also features improved documentation templates with revised forms that now highlight the most important information of every KPI, making them simpler to comprehend, communicate, and incorporate into performance systems. All KPIs have been extensively reviewed and updated to address the most recent business trends, so the report continues to be a current and useful resource.

Whether you’re revitalizing an existing measurement system or advocating for KPI adoption within your organization, the Top 25 Strategy and Performance Management KPIs – 2025 Edition is an essential resource for keeping pace with performance management best practices. You can download the digital version via the TKI Marketplace or get your hands on the print version by ordering via Amazon. Secure your copy today!

The Top 25 Oil and Gas KPIs Report has arrived: what’s inside the first edition of the 2025 series?

April 16th, 2025 Posted by KPIs 0 thoughts on “The Top 25 Oil and Gas KPIs Report has arrived: what’s inside the first edition of the 2025 series?”

From powering vehicles on daily commutes to fueling airplanes across continents, from heating homes during cold seasons to generating electricity that lights up cities, oil and gas are deeply embedded in life. Even the production and transport of countless everyday items depend on these energy sources—we rely on them to keep the world moving and growing.

The oil and gas industry is one of the largest sectors in the world in terms of dollar value. According to IBISWorld, the industry generated an estimated $4.2 trillion in global revenue by the end of 2024. This reflects a compound annual growth rate (CAGR) of 6.0%, with a modest 1.9% increase recorded in 2024 alone. 

This sustained growth reflects not only global energy demand but also the industry’s ongoing shift toward digital transformation. As oil and gas producers increasingly adopt advanced technologies like big data analytics and machine learning, the role of key performance indicators (KPIs) becomes even more vital. These innovations enhance exploration accuracy, boost production efficiency, reduce environmental impact, and generate vast performance data. Leveraging KPIs enables organizations to track these improvements, benchmark success, and make data-driven decisions that align with evolving energy demands and sustainability goals.

To support performance monitoring and strategic decision-making in the oil and gas industry, The KPI Institute has released the Top 25 Oil and Gas KPIs – 2025 Edition, the first report of the Top 25 KPIs series in 2025. This report combines the most relevant and widely used KPIs across the sector to offer valuable insights into operational efficiency, financial performance, safety, and sustainability. Whether for benchmarking, performance improvement, or aligning with industry best practices, the KPIs featured in this edition serve as essential tools for navigating the complexities of the oil and gas industry in 2025 and beyond.

What’s inside the report?

While the Top 25 KPIs series has been ongoing, this marks the first dedicated oil and gas edition since 2018, which presents refreshed content, updated metrics, and a more refined structure that reflects the evolution of our reporting approach over the years.

The Top 25 Oil and Gas KPIs – 2025 Edition report offers practical guidance on how KPIs can enhance clarity, focus, and overall performance. While they are a valuable starting point for identifying relevant KPIs, these reports are not intended as definitive solutions. Instead, they represent the most popular KPIs based on smartKPIs.com data and user engagement.

This report is designed for practitioners, academics, and consultants involved in performance management. It covers the basics of KPIs, such as explaining key terminology and their application across organizations to drive performance, highlighting KPIs’ role in the Performance Measurement Framework, and exploring the governance structures that will ensure effective management.

Furthermore, the report features an updated two-page KPI Documentation Form template, including refined fields based on The KPI Institute’s latest research. It also offers practical tips for KPI reporting and visual examples of scorecards and dashboards to support real-world applications.

For a quick overview, here are the top five KPIs from Top 25 Oil and Gas KPIs – 2025 Edition report:

  1. % Drilling rig utilization rate – Tracks the percentage of time an operational drilling rig is actively in use compared to the total time it is available for drilling activities.
  2. % Non productive drilling time (NPT) – Measures the percentage of time when drilling operations are halted or the penetration rate is significantly low, relative to the total production time.
  3. # Process leaks identified during operation or downtime – Quantifies the number of unintended substance releases from industrial equipment or systems during operational phases or scheduled downtime within the reporting period.
  4. $ Drilling cost per meter – Determines the average cost of drilling per meter or foot of well drilled.
  5. % Drilling success rate –  Measures the percentage of exploration wells that successfully encountered oil and gas reserves, compared to the total number of exploration wells drilled

Now that you’ve had a glimpse of the top metrics, are you ready to take your performance to the next level? Explore the Top 25 Oil and Gas KPIs – 2025 Edition for a deeper dive into each featured KPI above, plus 20 more in the report. Unlock practical insights to enhance operations, boost efficiency, and stay ahead in a competitive industry. Download the full report today by visiting the TKI Marketplace. You can also purchase a physical copy via Amazon

Quarterly KPI Highlights: from assets to output, measuring what matters in operations

March 26th, 2025 Posted by KPIs 0 thoughts on “Quarterly KPI Highlights: from assets to output, measuring what matters in operations”

Performance gaps often start not from a lack of effort, but from a lack of clarity. When teams don’t know what to aim for or how success is measured, resources are wasted, and strategic goals drift out of reach. One way to bridge the gap between strategy and execution could be to use key performance indicators (KPIs) that help translate abstract goals into measurable actions.

However, according to The KPI Institute’s State of Strategy Management Practice – 2023 Global Report, many organizations still face foundational challenges with KPIs: 25% struggle to align KPIs and targets across departments, while 24% find it difficult to select the right KPIs—an issue that has grown by 4% over the past year. Despite these hurdles, KPI usage remains strong across both people and business performance. In fact, the same report reveals that organizations primarily use KPIs in two key areas: employee performance evaluations and corporate performance monitoring, with 60% of respondents emphasizing both. 

With KPIs influencing both day-to-day decisions and long-term priorities, their impact is far-reaching. However, when not aligned with strategic goals, they can create a gap between what the organization aims to achieve and what it delivers. That is why it is critical that they reflect strategic priorities, not just routine activities.  

To put this all into practice, we’re highlighting two KPIs in Q1 2025 that directly link operational efficiency with broader strategic goals: 

KPI of February: % Return on assets (ROA) – This metric evaluates a company’s ability to generate profit from its total assets, shown as a percentage of net income to assets. It aims to analyze how well a business utilizes its assets to drive profitability.  Aligning asset utilization with strategic growth goals helps companies achieve greater financial efficiency and improve competitive positioning in their industry.

When evaluating % ROA, it’s important for companies to benchmark against peers in the same industry, as asset structures vary. For instance, manufacturing firms tend to be asset-intensive and rely heavily on physical resources to drive income. Unlike businesses in the technology or service sectors, these companies typically depend on intangible assets like software, data, or expertise.

To learn more about how to utilize this metric, get a free copy of the poster from TKI Marketplace.

KPI of March: % Production schedule attainment – This indicator measures how much of the actual production output was completed as scheduled within the reporting timeframe. This metric helps verify whether the production process stays on track with the planned schedule.

Organizations can improve their % Production schedule attainment by adopting scheduling techniques that align with their business model and operational requirements. When production is on schedule, organizations can reduce costs, improve resource utilization, and enhance customer satisfaction, all of which directly contribute to long-term competitiveness and profitability. To explore how various scheduling methods impact this KPI and gain deeper insights into the indicator, download a free copy of the poster from the TKI Marketplace.

These digital posters are part of the KPI of the Month series by The KPI Institute. It is a free infographic series designed to provide practical insights into the application of key performance indicators. Each edition focuses on one specific KPI, offering clear explanations of terminology, addressing common challenges in its use, and outlining essential details such as its definition, calculation, Balanced Scorecard relevance, data profile, typical targets, and actionable recommendations.

Performance Struggles? These KPI Posters Might Be the Fix

March 12th, 2025 Posted by KPIs 0 thoughts on “Performance Struggles? These KPI Posters Might Be the Fix”

 The KPI Institute (TKI) has introduced a full series of key performance indicator (KPI) posters aimed at improving strategy and performance management in organizations. This initiative underlines TKI’s continuing mission in promoting business excellence by offering leaders practical resources for sharpening their managerial and operational focus.

The KPI posters for strategy and performance management are part of the broader KPIs for Functional Areas series. This series explores KPIs tailored to different organizational functions, aligning them with strategic objectives using the balanced scorecard framework. Each set of posters offers detailed insights into KPI definitions, component metrics, and calculation methods, drawing on TKI’s extensive consultancy experience.

The KPI posters for strategy and performance management focus on four key areas:

  1. KPIs for Corporate Performance Management: These metrics provide a detailed analysis of the health and performance of an organization. They monitor performance in relation to strategic plans and guarantee compliance with strategic directions. Examples are % KPIs below target and # Time to compile the performance report.
  2. KPIs for Strategic Planning: These measurements are useful for leaders to create and implement efficient strategic management plans. Examples are # Stakeholder Engagement Index, % KPIs updated in the system, and # Strategic workshops conducted.
  3. KPIs for Initiatives Management: Through monitoring the level of accomplishment and results, these KPIs assist in confirming that certain organizational undertakings are on track and delivering expected outcomes. Examples are # Resource capacity per project, % Portfolio budget spending, and # Benefit cost-ratio of strategic initiatives.
  4. KPIs for Performance Analytics: Metrics in this category are used to help in the decision-making process by giving a trend analysis of performance. They support the executives in the evaluation of data and defining areas of potential enhancement. Examples are % Decisions based on data insights and # Data security incidents.

Discover how these KPI posters can benefit your organization. Download them for free here: KPIs for Strategy and Performance Management.

Common project management pitfalls and the KPIs that can help to avoid them

February 26th, 2025 Posted by KPIs 0 thoughts on “Common project management pitfalls and the KPIs that can help to avoid them”

Project management is much like an iceberg—while deadlines, budgets, and deliverables are the visible markers of success, underlying challenges often lurk beneath the surface. Hidden risks, inefficiencies, and misaligned expectations can quietly accumulate until they result in significant setbacks. 

Many projects struggle due to poor stakeholder engagement, uncontrolled scope expansion, inefficient resource allocation, and inadequate risk planning. One way to address these challenges is to implement key performance indicators (KPIs). Choosing and utilizing the right KPIs helps organizations identify the challenges early and provides measurable insights that can guide decision-making, enhance accountability, and ensure projects stay aligned with strategic goals.

To navigate these challenges, let’s examine common project management pitfalls and the KPIs that can help mitigate them.

Common Project Management Pitfalls

One of the common project management pitfalls is ineffective resource management, characterized by overallocation that leads to burnout and delays, and poor visibility, which hinders efficient task assignment. Additionally, underutilization wastes capacity and increases costs.

When resources are not effectively allocated, some employees become overburdened while others remain underutilized, leading to inefficiencies and workplace dissatisfaction. According to Gallup, a survey of nearly 7,500 full-time employees revealed that 23% frequently or always feel burned out at work, while another 44% experience burnout occasionally, which means nearly two-thirds of workers face this issue.

Furthermore, Gallup explained that the organizational impact of burnout is significant because burned-out employees are 63% more likely to take sick leave and 2.6 times more likely to look for a new job. Even those who remain tend to have 13% lower confidence in their performance and are half as likely to engage in goal-setting discussions with their managers, reducing overall productivity and engagement.

Another common pitfall is project financial management, where poor budgeting, inaccurate forecasting, and uncontrolled expenses cause cost overruns and financial instability. Without proper cost tracking, projects exceed budgets due to unforeseen expenses, inefficient resource allocation, or scope creep. Limited financial visibility leads to funding shortages, rushed decisions, and compromised quality.

Project financial management controls expenses, revenue, and profit through budgeting, cost estimation, funding, and expense tracking. The project manager oversees budget adjustments to ensure completion within budget, scope, and timeline.

According to TeamStage, cost overruns are a major challenge, with 55% of project managers citing them as a reason for project failure. While effective financial management establishes clear roadmaps and milestones, only 34% of projects stay within budget, underscoring the prevalence of financial mismanagement.

To overcome challenges, organizations can leverage KPIs to enhance project management. The KPI Institute’s Top 25 Project Management KPIs – 2024 edition report provides valuable insights that would help organizations identify and apply the most relevant metrics to enhance performance and ensure project success.

Top 5 KPIs to Optimize Project Resources and Finances

1. # Earned man-hours – tracks the total man-hours corresponding to completed work, assessing job productivity and project progress. Businesses are encouraged to adopt a man-hours-based monitoring approach, which involves tracking planned, earned, and actual man-hours with labor efficiency. This method ensures accurate monitoring, aids manpower planning, and improves execution efficiency.

  1. % Project budget variance – calculates the deviation between actual and planned project costs upon completion, reflecting financial discipline in project planning and execution. Budget overruns often stem from inaccurate cost estimation or delays leading to extra expenses. An ideal budget variance aligns with project goals and organizational objectives while demonstrating effective financial management.
  2. # Schedule Performance Index (SPI) – evaluates project progress by comparing earned value to planned value, indicating efficiency in value generation. A higher ratio reflects better alignment with the planned schedule, ensuring optimal resource utilization and timely project completion.
  3. % Project resource utilization – calculates the percentage of allocated man-hour resources utilized in a project, reflecting resource planning accuracy and utilization efficiency. Automated tracking through project management software enables real-time monitoring at various stages, milestones, or project completion, ensuring optimal resource use.
  4. $ Cost avoidance savings – tracks savings from cost avoidance initiatives, such as procurement strategies and process improvements, by preventing future expenses rather than reducing current costs. This KPI helps monitor financial efficiency through negotiating better supplier terms, securing lower purchase prices, obtaining free value-added services, or establishing long-term contracts with price protection.

These KPIs are part of The KPI Institute’s Top 25 Project Management KPIs, a report within the Top 25 KPIs 2024 series, highlights the most widely used KPIs across industries based on smartKPIs.com viewership data from January 2023 to April 2024.

The report provides insights into performance measurement trends, KPI challenges, usage contexts, and 10 strategies for effective implementation. Each KPI has been thoroughly researched and updated to reflect the latest business trends. The 2024 edition also features an improved documentation template to ensure key details are presented. 

Explore more project management KPIs by downloading the Top 25 Project Management KPIs – 2024 Edition today via the TKI Marketplace. You can also get your copy now through Amazon.

Quarterly KPI Highlights: tracking expansion revenue, employee focus time, and EBITDA

December 11th, 2024 Posted by KPIs 0 thoughts on “Quarterly KPI Highlights: tracking expansion revenue, employee focus time, and EBITDA”

The KPI Institute launched a series of free infographics called KPI of the Month to offer insights into the practical application of KPIs. Each infographic focuses on a particular key performance indicator (KPI) that provides explanations of terminology and addresses key challenges related to its use. The monthly infographics include definition, calculation, balanced scorecard focus, data profile, targets, and practical recommendations. 

Throughout the year, we have diligently tracked performance and growth, culminating in this comprehensive review of Quarterly KPI highlights. As we dive into the 2024 last quarter’s key metrics— % Expansion revenue, # Focus time, and $ Earnings before interest, taxes, depreciation, and amortization (EBITDA)—these insights may offer valuable guidance for shaping strategies, improving productivity, and driving financial success in the year ahead. 

As you set your sights on 2025, these KPIs offer actionable insights for optimizing performance across various business areas. Whether refining customer engagement strategies, enhancing operational efficiency, or boosting financial outcomes, understanding and leveraging these metrics can help start the new year on the right foot and position your organization for continued success. So, let’s take a closer look at each of these metrics.

KPI of October: % Expansion revenue – This indicator measures revenue from upselling and cross-selling to current customers, relative to total revenue for the reporting period. Its purpose is to evaluate the effectiveness of strategies for increasing customer spending. For more details about this indicator, download the free poster via TKI Marketplace. 

KPI of November: # Focus time – This indicator measures the duration employees can maintain focus on critical work tasks without distractions to assess and optimize workflows, ensuring they foster greater efficiency and higher-quality results. How can organizations help employees improve # Focus time? One of the best practices is to encourage designated “no meeting” periods to allow for focused, uninterrupted work. Access more insights into this indicator by getting a free copy of the poster via TKI Marketplace.

KPI of December: $ Earnings before interest, taxes, depreciation and amortization (EBITDA) – This indicator “measures a company’s operational profitability, before accounting for interest, taxes, depreciation, and amortization costs.” Its purpose is to evaluate financial stability and operational effectiveness. To learn more about how to utilize this metric and its practical applications, get a free copy of the poster from TKI Marketplace.

This holiday season, unwrap a wealth of knowledge and expand your understanding of KPIs with a treasure trove of examples from various industries and functions. Explore the world’s largest database of KPIs and customizable dashboards—visit smartKPIs.com today and gift your business the insights it needs for success in the new year!

Top 25 KPIs for managing essential utilities: electricity, natural gas, and water and sewage

November 13th, 2024 Posted by KPIs, Publications 0 thoughts on “Top 25 KPIs for managing essential utilities: electricity, natural gas, and water and sewage”

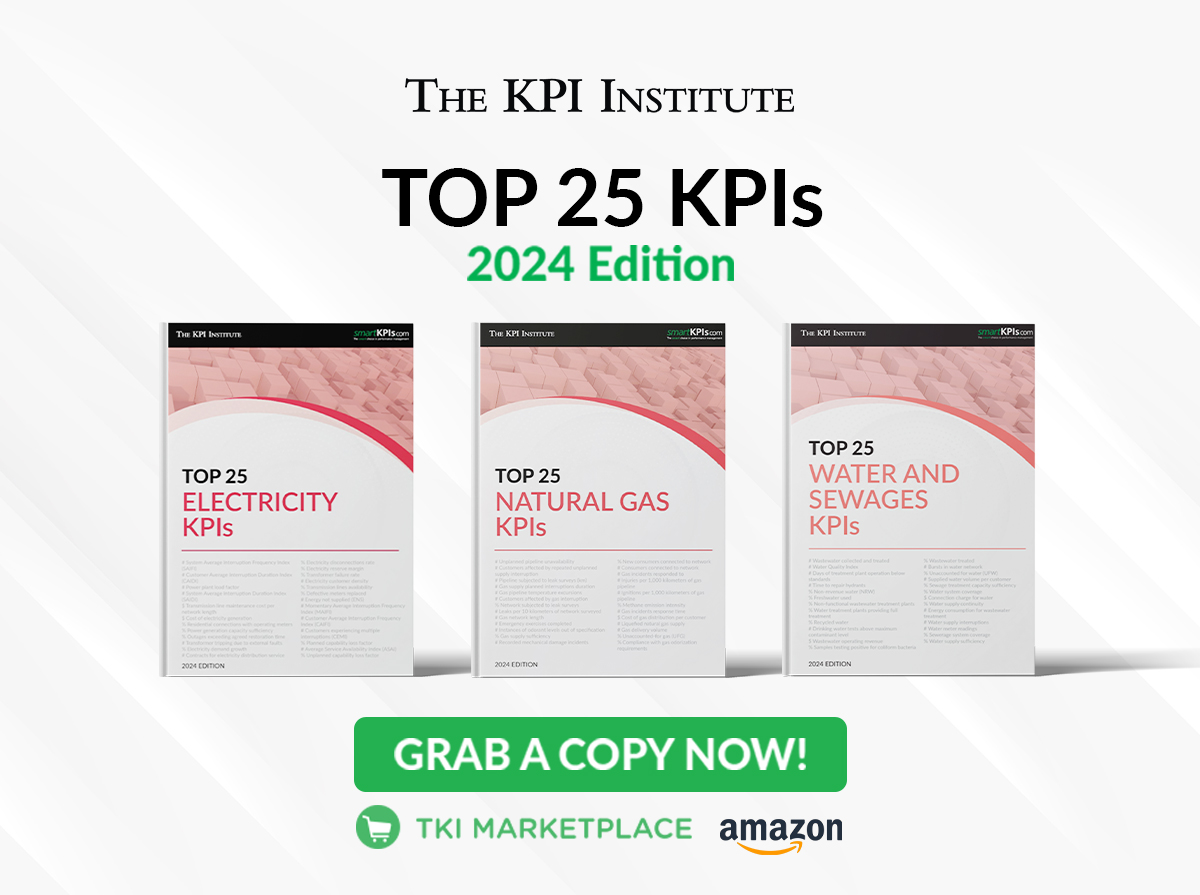
Utilities such as electricity, natural gas, and water and sewage services are the backbone of modern society, supporting everything from basic daily activities to critical infrastructure. Without these essential services, communities would struggle to function, and economies would come to a halt. 

In the latest release of the Top 25 KPIs report series, The KPI Institute dives into the critical key performance indicators (KPIs) essential for managing vital utility services. As the demand for efficient and sustainable service delivery continues to rise, understanding and leveraging the right KPIs is more important than ever. 

The Top 25 KPIs 2024 report series is an extensive collection of the 25 most commonly utilized KPIs from various industries and functional areas. The KPIs are curated based on viewership data from smartKPIs.com between January 2023 and April 2024, this series provides a snapshot of the latest trends in performance measurement.

Inside the report, readers can find a comprehensive analysis of the Performance Measurement Concept Framework, the most recent data on KPI challenges and usage contexts, and 10 strategies for successful KPI implementation. Moreover, each KPI featured has been thoroughly revised through extensive research to ensure that the information accurately captures the latest trends and changes in the evolving business environment. The 2024 edition also offers an enhanced documentation template that is optimized to present the most pertinent details about each KPI.

Whether readers are looking to enhance operational efficiency, reduce downtime, or deliver superior customer satisfaction, the Top 25 KPIs for utilities provide a comprehensive framework for driving performance improvements in this dynamic industry. In each report, let’s take a quick look at the top five KPIs for water and sewage, electricity, and natural gas.

Top 5 Water and Sewage KPIs 

  1. # Wastewater collected and treated –  measures the total volume of wastewater collected and treated in the reporting period
  2. # Water Quality Index – measures the quality of water based on five parameters – Temperature, Biological Oxygen Demand, Total Suspended Solids, Dissolved Oxygen, and Conductivity
  3. # Days of treatment plant operation below standards – measures the number of days during which the water treatment plant operates below established performance standards
  4. # Time to repair hydrants – measures the average time taken to repair a broken or inoperative hydrant
  5.  % Non-revenue water (NRW) –  measures the percentage of water that enters the distribution system but is lost before reaching customers and not billed, out of the volume of water supplied

Learn more about the practical applications of the indicators above, as well as the other top 20 KPIs for the water and sewage sector, grab a copy of the Top 25 Water and Sewage KPIs – 2024 Edition report. It is available for digital purchase via the TKI Marketplace and as a physical copy on Amazon.

Top 5 Electricity KPIs

  1.  # System Average Interruption Frequency Index (SAIFI) –  measures the average number of electricity system interruptions per customer during the reporting period
  2.  # Customer Average Interruption Duration Index (CAIDI) – measures the average duration of electricity supply interruptions experienced by customers during the reporting period
  3. # Power plant load factor –  measures the ratio of the average load to the peak load in the reporting period
  4. # System Average Interruption Duration Index (SAIDI) – measures the average duration of electricity supply interruptions per customer, during the reporting period
  5. $ Transmission line maintenance cost per network length –  measures the average expenditures incurred with the maintenance of transmission lines relative to the length of the network

Explore more insights about the top 5 Electricity KPIs and other 20 indicators by purchasing the digital copy of the Top 25 Electricity KPIs – 2024 Edition, visit TKI Marketplace. Furthermore, a physical copy can be ordered via Amazon.

Top 5 Natural Gas KPIs

  1. # Unplanned pipeline unavailability –  measures the duration, in hours, that a pipeline is not operational for transporting gas due to unplanned circumstances
  2. # Customers affected by repeated unplanned supply interruption – measures the number of customers impacted by multiple instances of unplanned supply interruption in the reporting
  3. # Pipeline subjected to leak surveys (km) – measures the length, in kilometers, of the gas pipeline network that was subjected to leak detection surveys in the reporting period
  4. # Gas supply planned interruptions duration – measures the average duration, in minutes, of planned gas supply interruptions experienced by customers in the reporting period
  5.  # Gas pipeline temperature excursions – measures the number of gas pipeline temperature excursions recorded during  a specified reporting period

Gain a deeper understanding of the practical use of the top 5 KPIs above and discover the other 20 Natural Gas KPIs. Download a digital copy of the Top 25 Natural Gas KPIs – 2024 Edition via TKI Marketplace or purchase another copy via Amazon.

As the demand for reliable, sustainable services continues to grow, understanding how to optimize utility operations is more critical than ever. Let the Top 25 KPIs 2024 report series from The KPI Institute serve as your guide in selecting the most critical KPIs and tracking your organization’s progress towards its strategic goals.

Quarterly KPI highlights: metrics in inventory, brand strength, and customer acquisition

October 9th, 2024 Posted by KPIs 0 thoughts on “Quarterly KPI highlights: metrics in inventory, brand strength, and customer acquisition”

The KPI Institute launched a series of free infographics called KPI of the Month to offer insights into the practical application of KPIs. Each infographic focuses on a particular key performance indicator (KPI) that provides explanations of terminology and addresses key challenges related to its use. The monthly infographics include definition, calculation, balanced scorecard focus, data profile, targets, and practical recommendations. 

To ensure that you stay informed and updated, we highlight in this article the KPI of the Month from the third quarter of 2024, focusing on three KPIs that can significantly impact any organization in any field or industry: # Inventory turnover ratio # Employment brand strength, and $ Customer acquisition costs.   

By examining these metrics, you can gain insights into operational efficiency, market positioning, and overall profitability. Furthermore, organizations can gain a holistic view of their performance and make informed decisions that can position them for sustainable growth and success when the indicators mentioned are fully grasped. So whether seeking to optimize inventory management, strengthen employer brand, or reduce customer acquisition expenses, you can dive into these indicators and discover how they contribute to a thriving business. 

KPI of July: # Inventory turnover ratio – This indicator “measures the number of times the inventory has been sold and replaced within the reporting period.” Based on its practice recommendation, # Inventory turnover ratio is influenced by various factors such as product characteristics, market demand, and business models. Access more insights into this indicator by getting a free copy of the poster via TKI Marketplace.

KPI of August: # Employment brand strength – This indicator evaluates the attractiveness of an organization as a workplace for employees and job seekers based on an index derived from survey responses and quantitative metrics. # Employment brand strength allows companies to tailor their calculation methods by selecting key themes and incorporating both survey data and KPIs. For more details about this indicator, download the free poster via TKI Marketplace.

KPI of September: $ Customer acquisition cost – This indicator determines the average cost associated with acquiring a new customer. It is crucial for companies aiming to achieve long-term profitability. In connection with $ Customer Lifetime Value, $ Customer acquisition cost assesses the cost efficiency of sales and marketing expenditures. By striving for an optimal ratio between these two indicators, businesses can refine their acquisition strategies, boost profitability, and minimize the payback period. To learn more about practical applications for this indicator, get a free copy of the poster from TKI Marketplace.

Enhance your KPI knowledge with a comprehensive collection of documented KPIs from various industries and functions. Explore the world’s largest database of KPI examples and customizable dashboards— visit smartKPIs.com today!

Top 25 human resources KPIs for driving strategic business decisions now available

September 18th, 2024 Posted by KPIs, Publications 0 thoughts on “Top 25 human resources KPIs for driving strategic business decisions now available”

The role of human resources (HR) extends far beyond traditional functions like recruitment and employee relations. Today’s HR professionals can influence organizational success through their evolving role in strategy and performance management.

HR has shifted from merely handling administrative tasks to leading workplace culture and engagement. A Forbes article highlights that the future of HR is defined by two main focus areas: enhancing the employee experience and driving innovation. Moreover, HR leaders are now integral to strategic business decisions, especially in addressing workplace trends, including artificial intelligence (AI) integration and addressing diversity, equity, and inclusion (DEI), and sustainability. 

HR can rely on key performance indicators (KPIs)  to ensure the effectiveness of their initiatives and processes. According to The KPI Institute’s State of Strategy Management Practice Global Report – 2023, organizations primarily use KPIs in two main areas: assessing employee performance and evaluating overall corporate performance. 

Integrating KPIs into employee evaluations helps set clear expectations, track progress, and provide feedback. Furthermore, using KPIs for corporate performance helps monitor progress toward strategic goals and drive organizational success. To guide HR leaders in selecting the most effective KPIs, The KPI Institute (TKI) has released the Top 25 Human Resources KPIs – 2024 Edition. This report series is designed to share TKI’s expertise in utilizing KPIs for performance measurement. Inside the report is a practical, step-by-step guide for improving performance, which highlights how KPIs can bring greater clarity, focus, and enhancement to any performance measurement process.

The 2024 edition of the Top 25 KPIs reports features a two-page KPI Documentation Form Template. The first page includes updated fields based on the latest research and analysis from TKI, and the second page provides essential guidance on KPI reporting. The 2024 edition features practical examples of KPI results and illustrative designs for scorecards and dashboards for each KPI featured in the report.

The Top 25 Human Resources KPIs consist of 17 functional areas with 61 main functions, including accounting, information technology, and supply chain, procurement, and distribution. It also compiles from 25 industries with 100 divisions such as transportation, government – state / federal, and healthcare. 

The KPIs in this report are distributed in six categories: Retention, Talent Development, Recruitment, Workforce, Absenteeism, and Compensation and Benefits. In this year’s report, % Employee turnover is highlighted as the leading KPI, which falls under Retention. It “measures the rate at which employees leave the organization in a given time period (e.g., month, quarter, year).” 

To gain deeper insights into the significance and function of % Employee turnover and to uncover the other top KPIs shaping the HR industry, explore the Top 25 Human Resources KPIs – 2024 Edition. The full report is now available for purchase in print on Amazon and for digital download from the TKI Marketplace.


Quarterly KPI Highlights: optimizing customer engagement, operations, and agile practices

August 14th, 2024 Posted by KPIs 0 thoughts on “Quarterly KPI Highlights: optimizing customer engagement, operations, and agile practices”

Key performance indicators (KPIs) serve as essential navigational tools, guiding organizations toward success in both strategic planning and operational execution. 

According to the State of Strategy Management Practice Global Report – 2023, “KPIs are extensively employed in two main areas: employee performance evaluations and corporate performance assessments.” Using KPIs in employee evaluations establishes clear expectations, tracks progress, and offers feedback. Similarly, KPIs employed in corporate performance assessments track progress toward strategic goals.

The KPI Institute launched a series of free infographics called KPI of the Month to offer insights into the practical application of KPIs. Each infographic focuses on a particular KPI that provides explanations of terminology and addresses key challenges related to its use. The monthly infographics include profile, calculation, balanced scorecard focus, data profile, targets, and practical recommendations.

To ensure that you stay informed and updated, we’ve compiled the KPI of the Month from the second quarter of 2024: $ Customer Lifetime value, # Cycle time in Agile, and % Projects with benefits realized. These KPIs not only highlight essential aspects of customer engagement, operational efficiency, and project management, but also play crucial roles in promoting sustainable growth and enhancing organizational agility. Let’s take a look at each KPI and its function:

KPI of April:  $ Customer Lifetime value – This indicator “measures the monetary value a company anticipates earning from a customer throughout their lifetime as a paying client.” Its purpose is to determine the value of customers based on their unique characteristics. Moreover, utilizing this indicator can assist organizations in refining marketing strategies, improving customer retention, and maximizing long-term profitability. To learn more about the $ Customer Lifetime value, download the poster on TKI Marketplace.

KPI of May:  # Cycle time in Agile – The purpose of this indicator is to assess the effectiveness of the development process of a team. It determines the average amount of time needed to accomplish a task from the time it starts the development process until it is finished and delivered. The # Cycle time in Agile helps find areas where processes can be streamlined by measuring output and delivery speed across several iterations. Download the free digital poster via TKI Marketplace.  

KPI of June: % Projects with benefits realized – This indicator measures the proportion of projects in the portfolio that have achieved or realized the expected benefits in relation to the total number of projects in the portfolio. Projects that use the benefits realization method seek to offer particular outputs in addition to strategic aims. To learn more about practical applications for this indicator, get a free copy of the poster from TKI Marketplace.

To widen your KPI expertise with an extensive collection of documented KPIs across diverse industries and functions, visit smartKPIs.com— a leading online platform dedicated to performance measurement and KPI management. It hosts the world’s largest database of documented KPI examples, offering resources such as KPIs by industry and department, and dashboards. Check it out now!

Recent Comments

    Archives