
Posts by admin

Inside a KPI professional’s toolkit: from KPI selection to target setting

October 21st, 2026 Posted by Certifications, E-learning 0 thoughts on “Inside a KPI professional’s toolkit: from KPI selection to target setting”

Key performance indicators (KPIs) help organizations assess progress toward strategic objectives, monitor operational results, and identify areas that require attention. However, effective performance measurement involves more than choosing a few metrics and tracking their results. Professionals must also determine what to measure, establish appropriate targets, organize performance information, and review results in the context of organizational priorities.

A structured approach can help professionals move from selecting indicators to using performance data in decision-making. Understanding the key stages of this process is a useful starting point.

What Does a KPI Professional Need to Consider?

Developing a performance measurement system involves several connected activities. Each requires a different set of considerations and tools.

1. Selecting the Right KPIs

The first step is to determine which indicators best reflect the objectives being measured. A KPI should relate to a specific performance priority and provide information that supports assessment or decision-making.

Professionals can begin by examining strategic objectives, identifying the results that matter, and researching indicators relevant to their industry or functional area. They must then assess whether the selected KPIs are appropriate for their organizational context and whether the required data is available.

Using an indicator simply because it appears on a popular KPI list does not guarantee that it will be relevant to a particular organization.

2. Defining Measures and Targets

After selecting the indicators, professionals need to clarify how each KPI will be measured. This involves defining the metric, its calculation method, the data source, the reporting frequency, and the person or team responsible for monitoring it.

Target setting is another important step. A target establishes the expected level of performance within a defined period. It should be considered in relation to organizational objectives, historical results, available resources, and other relevant evidence.

Without clear definitions and appropriate targets, different teams may interpret the same KPI differently or struggle to assess whether performance meets expectations.

3. Organizing Performance Information

Once KPIs and targets have been established, professionals need a way to present and communicate the resulting information.

Scorecards and dashboards can organize indicators, targets, and actual results so that users can review performance more systematically. The format should reflect the needs of its intended audience. An operational team may require detailed measures for day-to-day monitoring, while senior management may need a more concise overview of strategic performance.

The choice of presentation also matters. Performance information should be understandable, consistent, and relevant to the decisions users need to make.

4. Monitoring and Reviewing Results

Performance measurement continues after a system has been designed. Professionals must review actual results against targets, investigate significant deviations, and determine whether corrective action is necessary.

A review should go beyond identifying whether a target was met. It should also consider the factors behind the result, the implications for organizational objectives, and the actions that may improve future performance.

Regular reviews can help organizations identify recurring issues, reconsider assumptions, and determine whether their existing indicators remain appropriate.

Why Reference Materials and Practical Tools Matter

Each stage of KPI management presents different challenges. Researching indicators requires access to relevant references. Designing a scorecard or dashboard requires a suitable structure. Monitoring performance requires clear definitions and consistent reporting practices.

Professionals do not necessarily need to develop every resource from scratch. Existing references and templates can provide starting points for their work, reduce the effort involved in preparing supporting documents, and help them explore different approaches.

However, these resources should be selected carefully. A template or KPI reference is most useful when it fits the organization’s objectives, industry, data requirements, and measurement practices. It should support professional judgment rather than replace it.

Exploring Resources for KPI Professionals

For professionals looking for reference materials and practical tools, The KPI Institute’s Marketplace brings together several resource categories related to KPI research and performance measurement.

KPI Dictionaries for Indicator Research

The KPI Dictionaries collection includes references organized by industry and functional area. Listed areas include healthcare, financial institutions, utilities, transportation, real estate, professional services, government, finance, human resources, information technology, marketing, supply chain, and sales and customer service.

These dictionaries can serve as starting points for researching indicators relevant to a particular business function or industry. Professionals can then assess which measures best correspond to their objectives and measurement requirements.

Templates for Scorecards, Dashboards, and Toolkits

The Templates collection includes resources for performance measurement and employee performance. Its categories include scorecards, dashboards, and toolkits, with examples for specific industries and functional areas.

Listed resources include recruitment agency scorecards and dashboards, restaurant performance resources, and templates for healthcare and library settings.

Professionals can explore these options when preparing performance reports or developing documents to organize and communicate KPI results. Any template should be adapted to the organization’s specific requirements.

smartKPIs Subscription Options

For ongoing KPI research, professionals can also explore the smartKPIs subscription options. The Marketplace lists Standard and Premium subscription options for accessing the smartKPIs resource.

Those who regularly research indicators across different projects or functional areas can review the available subscription details and assess which option suits their needs.

Building a More Structured Approach to KPI Management

Effective KPI management connects indicator selection, target setting, reporting, and performance review. Each stage contributes to a measurement process that helps professionals assess results and understand how they relate to organizational objectives.

The right resources can support this work, but their usefulness depends on how well they fit the organization’s context and how consistently they are applied.

Professionals seeking additional references for KPI research and performance measurement can explore The KPI Institute’s Marketplace, including its KPI Dictionaries, templates, and smartKPIs subscription options.

Explore the available resources at The KPI Institute Marketplace.

20 career trends to watch in 2027: How can professionals stay competitive?

October 16th, 2026 Posted by Certifications 0 thoughts on “20 career trends to watch in 2027: How can professionals stay competitive?”

Artificial intelligence, data literacy, strategic thinking and continuous learning are among the forces changing professional careers. Research points to a growing need for workers who can combine technical knowledge with sound judgment, communication and business understanding.

Preparing for 2027 requires more than keeping up with new technologies. Professionals must also understand how employers’ expectations are changing, which capabilities are becoming more important and how to apply their expertise to organizational goals.

The World Economic Forum’s Future of Jobs Report 2025 draws on a survey of more than 1,000 employers representing over 14 million workers across 55 economies. Its findings indicate that 39% of workers’ existing skill sets could change or become outdated between 2025 and 2030. Meanwhile, 63% of surveyed employers identify skills gaps as a major barrier to business transformation.

These findings suggest that professionals should approach career development as an ongoing process. The following 20 trends, supported by research from international organizations, independent research institutions and government statistical agencies, highlight areas worth watching in 2027.

Artificial intelligence and digital skills

1. AI literacy becomes a workplace priority. Pew Research Center found that 21% of employed Americans said at least some of their work was done with AI in September 2025, up from 16% roughly a year earlier. Professionals can prepare by learning to use AI tools for appropriate tasks while checking accuracy, protecting sensitive information and understanding their limitations. Source: Pew Research Center

2. Human judgment remains essential in AI-assisted work. Among workers who had used AI chatbots at work, 40% said the tools were extremely or very helpful in completing tasks faster, while 29% reported similar benefits for work quality. Professionals should learn to evaluate AI-generated outputs rather than equating speed with accuracy. Source: Pew Research Center

3. Data literacy extends beyond specialist roles. The U.S. Bureau of Labor Statistics projects employment for data scientists to grow by 33.5% between 2024 and 2034. Although this forecast concerns a specific occupation, it reflects demand for specialized data expertise. Professionals in other fields can benefit from learning to interpret trends, question assumptions and communicate findings. Source: U.S. Bureau of Labor Statistics

4. Cybersecurity awareness becomes a broader professional responsibility. Employment for information security analysts in the United States is projected to grow by 28.5% from 2024 to 2034. Employees outside cybersecurity roles also need to understand secure data handling, access controls and common digital threats. Source: U.S. Bureau of Labor Statistics

5. Digital adaptability matters more than familiarity with one tool. Eurostat reported that 40% of EU citizens lacked at least basic digital skills in 2025. Learning to work with unfamiliar software, digital platforms and emerging technologies can help professionals respond to changing job requirements. Source: Eurostat, Digitalisation in Europe 2026

Analytical thinking and business performance

6. Analytical thinking remains a core skill. Seven in ten companies surveyed for the WEF’s Future of Jobs Report 2025 identified analytical thinking as an essential skill. Professionals can apply it by examining evidence, identifying the causes of problems and comparing possible solutions before making decisions.

7. Strategic thinking becomes relevant at every career level. The WEF found that 63% of surveyed employers considered skills gaps a major barrier to business transformation. Professionals who understand organizational priorities and how their work contributes to them can make better-informed decisions about time, resources and competing demands. Source: WEF, Workforce Strategies

8. KPI literacy supports better performance decisions. The WEF’s finding that seven in ten companies consider analytical thinking essential highlights the importance of interpreting evidence. Understanding key performance indicators (KPIs) helps professionals distinguish activity from results. For example, a marketing specialist can examine conversion rates and lead quality instead of judging campaign performance solely by the number of posts published. Source: WEF, Skills Outlook

9. Data visualization helps professionals communicate findings. Research by the National Skills Coalition and the Federal Reserve Bank of Atlanta found that 92% of jobs analyzed in the United States required digital skills. Data visualization is one practical application: charts and dashboards can help teams understand performance trends, identify exceptions and communicate findings to decision-makers. Source: National Skills Coalition, Closing the Digital Skill Divide

10. Evidence-based problem-solving gains importance. The WEF identifies analytical thinking among the skills expected to remain important through 2030. Professionals can apply this capability by establishing a baseline, investigating the reasons behind a performance gap and testing corrective actions. A decline in customer satisfaction, for instance, may require analysis of response times, complaint types and service processes before a team changes its approach. Source: WEF, Skills Outlook

Leadership, collaboration and adaptability

11. Communication remains essential across occupations. In a Pew Research Center survey, approximately seven in ten employed adults or more considered interpersonal skills, written and spoken communication, critical thinking and basic computer skills very or extremely important for success in today’s economy. Professionals can strengthen these capabilities by writing clearer reports and adapting explanations to different audiences. Source: Pew Research Center

12. Adaptability becomes a career management skill. The WEF found that 70% of surveyed companies considered resilience, flexibility and agility core skills. Professionals can develop these qualities by responding constructively to feedback, adjusting plans when priorities change and learning from unsuccessful approaches. Source: WEF, Skills Outlook

13. Creative thinking supports innovation. The WEF reported that 64% of surveyed employers considered creative thinking a core skill. Professionals can apply it by questioning established processes, generating alternative solutions and testing new approaches to recurring problems. Source: WEF, Skills Outlook

14. Leadership extends beyond formal management roles. Leadership and social influence were considered core skills by 64% of employers in the WEF survey. Employees can demonstrate these capabilities by coordinating projects, clarifying responsibilities, supporting colleagues and helping teams reach shared objectives. Source: WEF, Skills Outlook

15. Collaboration across disciplines becomes increasingly relevant. The WEF identifies leadership and social influence, resilience and adaptability among the core skills employers seek. These capabilities are particularly useful when projects require coordination between finance, operations, marketing, human resources and technology teams. Source: WEF, Skills Outlook

Career resilience and changing labor-market needs

16. Lifelong learning becomes part of career planning. The WEF reported that 50% of surveyed employers had completed training, reskilling or upskilling measures for their workforces, compared with 41% in its 2023 report. Professionals can complement organizational training by regularly reviewing their skill gaps and pursuing relevant learning opportunities. Source: WEF, Future of Jobs Report 2025

17. Reskilling prepares workers for changing job requirements. The WEF estimates that 39% of workers’ existing skill sets could change or become outdated by 2030. Workers can prepare by identifying transferable skills and learning capabilities relevant to adjacent roles, rather than waiting until their current responsibilities change. Source: WEF, Future of Jobs Report 2025

18. Combining specialized expertise with complementary skills can broaden career opportunities. U.S. employment projections show that data scientists could see 33.5% employment growth between 2024 and 2034, while operations research analysts could see 21.5% growth. For professionals in other fields, combining domain knowledge with data interpretation, problem-solving and communication can strengthen their ability to contribute to complex decisions. Source: U.S. Bureau of Labor Statistics

19. Sustainability-related capabilities enter more career discussions. The WEF identifies environmental stewardship among the skills expected to increase in use by 2030. Professionals in operations, procurement, reporting and project management can prepare by learning how resource use, environmental impacts and sustainability measures relate to organizational decisions. Source: WEF, Skills Outlook

20. Career development becomes more intentional. With 63% of surveyed employers identifying skills gaps as a major barrier to transformation, professionals have a reason to plan their development around specific capabilities rather than collecting credentials without a clear objective. A practical plan identifies a target role, assesses current proficiency, selects relevant learning and measures progress through work outcomes. Source: WEF, Workforce Strategies

Turning career trends into professional development

The research points to a combination of technical and human capabilities. AI literacy and digital skills matter, but so do analytical thinking, strategic understanding, communication, leadership and adaptability. Professionals do not need to master all 20 areas at once. The more practical approach is to identify the skills most relevant to their current responsibilities and future career goals.

A focused development plan can start with four steps:

  • Assess current capabilities. Identify strengths and gaps in areas such as data analysis, KPI development, strategic planning and performance management.
  • Set a specific learning objective. Choose a capability that connects to a work challenge or a target role.
  • Apply new knowledge. Practise interpreting performance data, evaluating a project or translating organizational objectives into measurable outcomes.
  • Review progress. Look for improvements in decision-making, work quality or the ability to handle more complex responsibilities.

Structured professional training can help turn these goals into a learning plan. The KPI Institute offers training and certification programs in performance management, strategy and business planning, KPI development, data analysis, data visualization and related disciplines.

Professionals planning their development can explore the following 2026 training calendars to identify relevant courses:

The most effective learning choice is one that addresses a clear development need. Whether the priority is interpreting performance data, improving strategic planning or developing stronger performance management practices, a relevant course can provide a structured starting point.

GPAU announces Performance Excellence Digital Forum 2026

October 14th, 2026 Posted by Events, Uncategorized 0 thoughts on “GPAU announces Performance Excellence Digital Forum 2026”

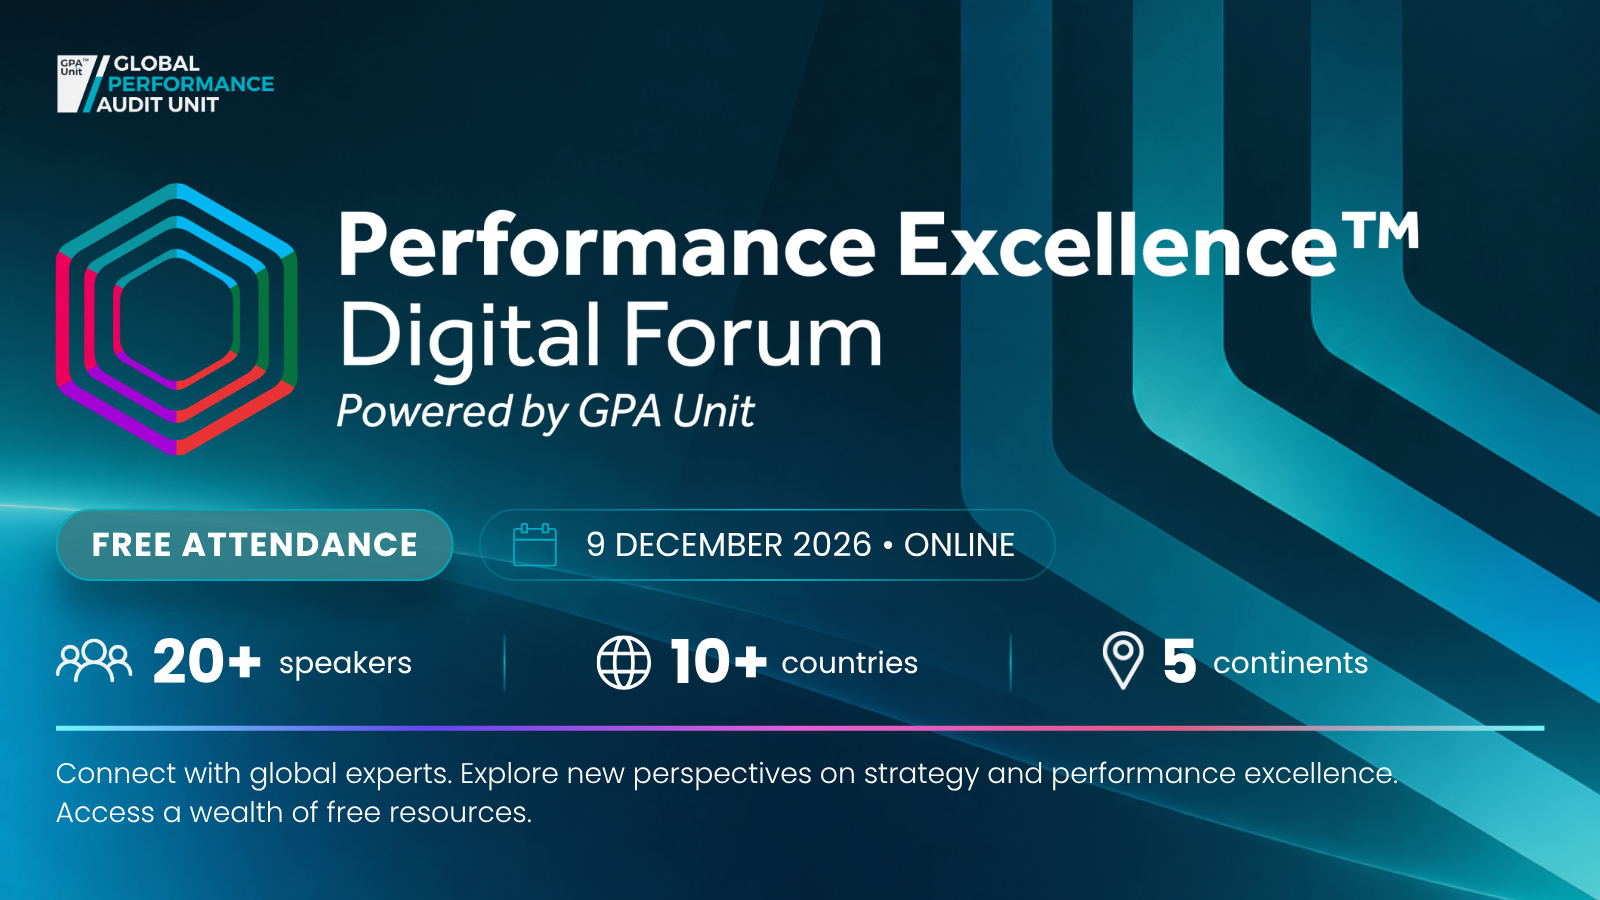
The Global Performance Audit Unit (GPAU) will host the Performance Excellence Digital Forum 2026 on 9 December 2026, bringing together international leaders, academics and practitioners to examine the factors behind sustained organizational performance.

The six-hour online event will feature original research, keynote presentations, organizational case studies and expert discussions on strategy execution, performance management maturity and organizational excellence. Under the central question, What Makes Organizations Perform?, the forum will explore how organizations develop management capabilities, translate strategy into action and respond to emerging challenges, including artificial intelligence.

The program will feature several highlights:

  • GPAU’s Strategy & Performance Maturity Outlook 2026: Research examining organizational maturity across five performance management capabilities, with insights into maturity levels and differences across industries.
  • Strategy execution and project management: Karla Eidem of the Project Management Institute (PMI) will discuss the role of project management in translating strategic priorities into organizational outcomes.
  • Organizational case studies: Albawani Holding and Canadian Forces Morale and Welfare Services will share practical perspectives on performance maturity and organizational improvement.
  • Academic perspectives on performance: Professors Pietro Micheli and Carmine Bianchi, alongside other experts, will examine the factors behind organizational performance, strategy, performance culture and the implications of artificial intelligence.
  • International perspectives and social impact: European Parliament Vice President Nicu Ștefănuță will participate in a discussion connected to GPAU’s Social Impact Through Excellence (SITE) initiative.

Additional discussions will address performance management frameworks, maturity assessments and the role of emerging technologies in organizational performance. By bringing together research and professional experience, the forum will provide an international platform for examining how organizations approach performance excellence across different sectors and contexts.

The event is open to professionals, researchers, organizational leaders and practitioners interested in strategy, performance management and organizational excellence.

The Performance Excellence Digital Forum 2026 will take place online on 9 December 2026, from 12:30 to 18:30 Riyadh time (GMT+3). Attendance is free.

Register for free and explore the full program: https://gpaunit.org/performance-excellence-digital-forum


How to turn confusing charts into clear business insights

October 9th, 2026 Posted by Certifications, Courses 0 thoughts on “How to turn confusing charts into clear business insights”

Organizations rely on charts, dashboards, scorecards, and reports to communicate performance and support business decisions. Yet a visualization can contain accurate data and still leave its audience struggling to understand what the results mean.

A crowded dashboard may hide an important performance gap. Inconsistent colors may confuse comparisons. A chart without clear labels may leave readers guessing what the numbers represent.

These problems are not always caused by the data itself. The way information is organized, presented, and communicated also affects how easily people can interpret it.

Data visualization helps people understand the significance of data by placing it in a visual context. It can reveal patterns, trends, and relationships that might be difficult to recognize in tables or text alone.

The challenge is to present information in a way that supports understanding rather than adding another layer of complexity.

Here are five practical principles for turning business data into clearer visual insights.

1. Start with the question, not the chart

Opening Excel or a dashboard tool and immediately choosing a chart is tempting. However, the first step should be to identify what the audience needs to understand.

Are you comparing performance across departments? Tracking changes in customer satisfaction? Examining differences between actual and target results? Showing how several categories contribute to a total?

The answer determines how the information should be organized and presented.

For example, imagine that a sales manager wants to compare the performance of five regional teams. A table can list each team’s results, but a bar chart may make differences easier to spot. If the manager wants to understand how sales have changed over the past 12 months, a line chart may communicate the trend more clearly.

The same dataset can support several visualizations, but each should serve a specific purpose.

Before selecting a format, consider these questions:

  • What do I want readers to understand? Identify the main finding, comparison, or relationship.
  • Who will use this information? Consider the audience’s familiarity with the subject and the level of detail they need.
  • What decision or action could the information support? Determine whether the visualization needs to highlight a performance gap, explain a trend, or compare alternatives.
  • Which format communicates the information most clearly? Choose a chart, table, infographic, dashboard, or another visual communication format based on the objective.

Try this: Before creating your next chart, write a one-sentence description of what the audience should learn from it. If you cannot define that message, clarify the purpose before proceeding.

2. Use visual hierarchy to guide attention

A visualization communicates through more than numbers. The position, size, color, and form of its elements influence what readers notice first.

This is why visual hierarchy matters.

Consider a performance dashboard containing 15 KPIs. If every number appears in the same font size, every chart uses equally prominent colors, and every section competes for attention, readers may struggle to identify the most important findings.

A stronger design establishes a clear order. The most relevant information receives greater prominence, while supporting details remain available without dominating the page.

Several design principles can help:

  • Emphasis: Give the main finding a distinct visual treatment so readers can identify it quickly.
  • Hierarchy: Arrange information according to its importance, using titles, headings, size, and position to establish priorities.
  • Contrast: Create sufficient differences between important elements and their surroundings.
  • Balance: Distribute visual elements so the layout feels organized rather than crowded on one side.
  • Consistency: Apply similar spacing, alignment, and formatting to related elements.

For example, a monthly performance report might begin with three headline indicators: overall performance, the largest deviation from target, and the most significant change since the previous month. Supporting charts can then explain the results in greater detail.

The objective is not to hide information. It is to make the main message easier to find.

Try this: Reduce your dashboard to a grayscale view. Can you still identify the most important information from its size, position, and layout? If everything appears equally prominent, reconsider the hierarchy.

3. Use color with a clear purpose

Color can distinguish categories, communicate differences, and draw attention to specific results. However, an attractive palette does not automatically produce an effective visualization.

The key is to establish a consistent relationship between color and meaning.

Suppose a company uses green for performance above target, amber for results close to target, and red for results below target. If these colors retain the same meaning across its reports, readers can interpret the results more quickly.

If the same colors represent unrelated categories in different charts, however, readers may misinterpret the information.

The Datawrapper guide to choosing colors for data visualization offers practical advice on color selection, contrast, gradients, and accessibility.

Apply these principles to business reporting:

  • Use consistent colors for the same categories. If a department is represented in blue in one chart, retain that color when showing the same department elsewhere.
  • Reserve accent colors for important findings. Use neutral tones for supporting information and stronger colors for the results that deserve attention.
  • Match the palette to the data. Use distinct hues for unrelated categories and ordered color gradients for numerical values that progress from low to high.
  • Explain what the colors mean. Add labels or a legend when the interpretation is not immediately clear.
  • Check readability and accessibility. Make sure that text and data points remain distinguishable against their backgrounds and that meaning does not depend on color alone.

For example, a dashboard could use neutral colors for most KPIs and a contrasting accent to highlight indicators that fall below their targets. This approach helps readers focus on exceptions without making every result compete for attention.

Color should support the message, not become the message.

Try this: Review one of your existing reports. If you remove half the colors, does the information become easier to interpret? If so, simplify the palette and reserve stronger colors for the most important distinctions.

4. Make the structure, typography, and labels work together

Even a well-chosen chart can be difficult to interpret when its layout is confusing or its labels are hard to read.

Structure determines how information is arranged. Typography affects readability and emphasis. Labels, titles, and annotations explain what the visual elements represent.

These components need to work together.

Imagine a chart showing monthly customer complaints. The data is accurate, but the title says only “Customer Data,” the reporting period is missing, and the category labels use internal abbreviations. Readers may have to consult the surrounding report before they can understand the chart.

A few adjustments can make a substantial difference.

  • Give the chart a specific title. Instead of “Customer Data,” use “Monthly Customer Complaints, January–June 2026.” The revised title tells readers what they are looking at and establishes the period covered.
  • Place labels close to the information they explain. Direct labels can reduce the need to move between chart elements and a separate legend. Where a legend is necessary, keep it clear and easy to locate.
  • Use typography consistently. Establish a small set of font sizes and styles for titles, section headings, labels, and supporting text. Avoid decorative fonts or excessive variations that compete with the data.
  • Include units and relevant context. Specify whether a figure represents percentages, currency, hours, or absolute counts. When a comparison depends on a target or baseline, make that reference clear.
  • Use annotations to explain important changes. A short note can identify an unusual spike, a change in reporting methodology, or an event relevant to the data. The annotation should provide context without making unsupported claims about causation.

The Datawrapper guide to using text in data visualizations explores these techniques, including direct labeling, readable typography, annotations, and straightforward wording.

For example, if customer complaints increased in March, a chart annotation could identify a new reporting procedure introduced that month. The note provides context, but additional analysis would still be needed to establish whether the procedure caused the increase.

Try this: Ask a colleague who has not seen your report to explain one of its charts. If they cannot identify the subject, period, units, and main finding without your help, revise the title, labels, or annotations.

5. Follow a process from raw data to a finished visualization

Effective data visualization is not simply a matter of styling a finished chart. It involves a series of decisions about the data, its purpose, its representation, and the way readers will interact with the result.

A practical process helps make these decisions more systematic.

The following seven stages provide a useful workflow for business reporting:

1. Acquire the data. Gather the information needed to answer the business question. Check that the sources are appropriate and that the reporting period is clear.

2. Parse the data. Examine the dataset’s structure, fields, categories, and measurement units. Understand what each variable represents before using it.

3. Filter the data. Remove irrelevant information and address missing, inconsistent, or duplicate records where appropriate. Keep the selection of data aligned with the question being investigated.

4. Analyze the data. Examine the figures for patterns, differences, relationships, and exceptions. Check calculations and consider whether the available information supports the intended interpretation.

5. Represent the data. Select an appropriate visual format and organize the information so the intended comparison or relationship is easy to recognize.

6. Refine the visualization. Review the layout, hierarchy, typography, colors, labels, and annotations. Remove elements that distract from the main message and correct anything that could mislead readers.

7. Add interaction where useful. Consider whether filters, tooltips, or interactive elements would help the audience explore the information. Use them when they serve a clear purpose rather than adding complexity for its own sake.

This process also highlights an important distinction: a technically correct chart is not necessarily an effective one. The visualization must represent the data accurately and communicate its meaning to the intended audience.

A final review before publishing

Before sharing a report, dashboard, or infographic, check the following:

The visualization answers a clearly defined question.

The selected format suits the type of information.

The main finding stands out without unnecessary decoration.

Colors, typography, and layout follow a consistent logic.

Titles, labels, units, and reporting periods are clear.

The figures and calculations match the source data.

The visualization does not exaggerate differences or imply unsupported conclusions.

The design remains readable and accessible to its intended audience.

The final output gives readers enough context to interpret the findings.

A useful final test is to ask whether the visualization communicates its main message without requiring the creator to explain every element. If it does, the design is doing its job.

Building data visualization capability

Creating effective visualizations requires more than knowing how to produce charts in Excel or assemble a dashboard. Professionals need to understand the data visualization process, select appropriate communication formats, apply design principles, and use structure, typography, and color to present information clearly. They also need to evaluate finished visualizations for accuracy, readability, and effectiveness.

The Certified Data Visualization Professional certification from The KPI Institute addresses these capabilities through a structured learning program. The course covers data visualization parameters, the visualization process, visual communication channels, layout and design principles, typography, iconography, color theory, and reporting formats such as scorecards, dashboards, and infographics. It also includes practical reporting exercises and the assessment of real-world visualizations.

For professionals who prepare performance reports, develop dashboards, or communicate business results, the program offers a structured way to develop data visualization knowledge and apply it to workplace reporting.

Learn more about the Certified Data Visualization Professional certification: https://kpiinstitute.org/data-visualization-certification-presentation/

The top 5 skills behind better data-driven decisions

October 1st, 2026 Posted by Certification, Courses 0 thoughts on “The top 5 skills behind better data-driven decisions”

Organizations have access to more business data than ever. Sales figures, customer information, financial results, operational metrics and employee data can all provide evidence for business decisions.

But having more data does not necessarily lead to better decisions.

The difference often comes down to the skills used to work with that data. Professionals need to know how to identify the right questions, prepare information for analysis, apply appropriate techniques and communicate what the results mean.

For organizations seeking stronger data-driven decision-making, these capabilities are becoming increasingly relevant.

Here are five skills that can help professionals make better use of business data.

1. Understanding the business problem

Effective data analysis starts with understanding what the organization is trying to solve.

A business question provides direction for the entire analytical process. It helps determine what information is needed, which variables should be examined and which analytical approach is appropriate.

Without a clearly defined problem, professionals can spend significant time processing data without producing findings that support an actual decision.

This makes business understanding an important foundation for data analysis. Analysts need to connect the information they are examining with organizational objectives, operational challenges and the decisions that need to be made.

2. Preparing and organizing data

Business data rarely arrives in a form that can immediately be analyzed.

Information may come from different sources, contain missing values or follow inconsistent formats. Data preparation involves organizing the information and identifying issues that could affect the reliability of the analysis.

Professionals therefore need to understand different data types, sources and collection approaches. They also need to recognize how data quality can affect the conclusions drawn from it.

Good analysis depends on having data that is fit for the question being investigated.

3. Applying the right analytical techniques

Knowing how to calculate a result is only part of data analysis.

Professionals also need to determine which technique is appropriate for the problem and the type of data available. Descriptive statistics can help summarize what has happened, while statistical testing can help assess whether observed differences or relationships are meaningful.

The objective is not to make an analysis unnecessarily complex.

It is to use an appropriate method and interpret the results correctly.

This requires familiarity with statistical concepts and analytical tools, as well as the ability to apply them within a business context.

4. Interpreting what the numbers mean

Data can show patterns, differences and relationships. Interpretation helps explain what those findings could mean for the organization.

Consider a business that notices a decline in sales in one customer segment. The number itself identifies a change, but further analysis is needed to understand whether the decline relates to pricing, customer behavior, seasonality, product availability or another factor.

This is where analytical thinking becomes important.

Professionals need to examine findings critically, consider the context and avoid drawing conclusions that the available evidence does not support.

A strong analyst does more than report numbers. They help others understand what the numbers are saying.

5. Communicating insights clearly

Even a technically sound analysis has limited usefulness if decision-makers cannot understand the findings.

Data analysts need to present information in ways that make important patterns and conclusions easier to identify. Tables, charts, statistical results and concise explanations can all help communicate findings to different audiences.

This skill becomes particularly important when working with managers and other stakeholders who may not have a technical background.

The goal is to move from “Here is what the data says” to “Here is what the data means for the business.”

Building practical data analysis capability

These five skills are connected. Understanding the business problem guides data collection and preparation. The quality and type of data influence the analytical techniques that can be applied. The results then need to be interpreted and communicated in a way that supports business decisions.

Developing these capabilities therefore requires more than learning individual statistical methods or spreadsheet functions. Professionals need a practical understanding of the broader data analysis process.

The Certified Data Analysis Professional and Practitioner certifications from The KPI Institute provide a structured learning pathway for professionals seeking to develop these capabilities.

The programs cover areas including business understanding, data collection, data preparation, statistical techniques, data analysis, interpretation and practical application. The Practitioner certification also focuses on applying analytical knowledge and tools within real business environments.

For professionals who work with business data or want to strengthen their analytical capabilities, structured data analysis training and certification can provide a practical way to develop these skills and apply them to organizational challenges.

Sign up for the Certified Data Analysis Professional and Practitioner certification:
https://kpiinstitute.org/certified-data-analysis-presentation/

Are organizations measuring employee performance in the right way?

September 23rd, 2026 Posted by Certifications 0 thoughts on “Are organizations measuring employee performance in the right way?”

Employee performance is becoming harder to measure as the nature of work changes. Roles are becoming more interconnected, skills are evolving rapidly, and organizations are asking employees to contribute beyond narrowly defined job outputs.

The World Economic Forum’s Future of Jobs Report 2025 found that 39% of workers’ existing skill sets are expected to be transformed or become outdated between 2025 and 2030. The report also identifies analytical thinking, resilience, flexibility, leadership and social influence among the core skills employers consider important.

For Employee Performance Management (EPM), this raises a practical question: Can organizations continue to assess performance effectively when what constitutes good performance is changing?

Results are only one part of performance

Targets and KPIs remain central to performance management, but they do not always capture the full contribution of an employee.

The CIPD’s 2026 performance management evidence distinguishes between task performance, behaviors and other aspects of contribution. It also notes that where work relies heavily on teamwork, organizations may need to incorporate team-based goals or behavioral objectives rather than relying exclusively on individual targets.

This becomes particularly relevant as collaboration and human skills remain important alongside technological capabilities. The World Economic Forum identifies collaboration, leadership, resilience and analytical thinking among the skills employers expect to remain important as work evolves.

The challenge is defining what good performance looks like

A performance system can only be as effective as its criteria.

Employees need to understand what is expected, how performance will be assessed and how their objectives connect to organizational priorities. The CIPD recommends aligning individual and team objectives with organizational strategy while recognizing that different types of work may require different approaches to measurement.

For complex roles, rigid targets may not be sufficient. Learning objectives, competencies and behaviors can provide additional evidence of performance, particularly where outcomes depend on collaboration or changing circumstances.

Managers have to interpret the data

Performance management does not end with collecting ratings and KPIs.

Managers have to interpret results, provide feedback and determine what action is appropriate. The CIPD identifies people managers as central to performance management, with responsibility for connecting organizational and individual objectives, giving feedback and holding employees accountable. It also describes performance management as a continuous cycle rather than an isolated event.

That makes managerial capability an important part of the system. Clear criteria and data can support better decisions, but managers still need to understand the context behind the numbers.

Performance systems also need to account for changing skills

The skills an employee needs today may not be the skills the organization will need several years from now.

The World Economic Forum reports that 59 out of every 100 workers are expected to require training by 2030, reflecting the scale of anticipated workforce reskilling and upskilling needs.

For EPM systems, this creates a stronger connection between performance assessment and employee development. Competency frameworks, feedback and development objectives can help organizations identify not only whether employees are delivering current responsibilities, but also where capability needs to develop.

Building the capability

Designing an EPM system around objectives, performance criteria, competencies, feedback and improvement requires more than an appraisal form. The Certified Employee Performance Management Professional and Practitioner certifications from The KPI Institute cover EPM system architecture, strategic alignment, performance processes, criteria and competencies, as well as calibration and bias mitigation. For professionals responsible for designing or applying employee performance systems, the programs provide a structured framework for connecting performance management with organizational goals and practical workplace requirements.

ESG reporting is no longer optional. Where does the balanced scorecard fit in?

September 15th, 2026 Posted by Balanced Scorecard, Certifications, Courses, E-learning 0 thoughts on “ESG reporting is no longer optional. Where does the balanced scorecard fit in?”


Sustainability reporting has moved from a voluntary communications exercise to a regulatory obligation. Under the EU’s Corporate Sustainability Reporting Directive (CSRD), thousands of companies now face detailed, audited disclosure requirements on environmental, social and governance (ESG) performance — with similar expectations building through the ISSB standards internationally.

For many organizations, the instinct has been to treat this as a reporting problem: build the disclosures, satisfy the auditors, move on. A growing body of research suggests that framing is too narrow — and that organizations already running a Balanced Scorecard (BSC) are better positioned to meet these requirements as a matter of strategy rather than compliance.

Compliance is the floor, not the framework

A 2025 study in Management Decision makes this case directly. Examining how companies can operationalize the CSRD, the researchers propose implementing its requirements through a sustainability balanced scorecard, arguing that the exercise should integrate sustainability with corporate governance rather than sit alongside it as a separate disclosure workstream. Their proposed framework moves through four steps — identifying material themes, assessing current capability, formulating strategy and then reporting — deliberately placing reporting last, as an output of strategic work rather than its starting point.

That sequencing matters. Organizations that build ESG metrics only to satisfy disclosure rules tend to end up with indicators that are audit-ready but strategically disconnected — numbers that describe activity without informing decisions.

A well-established extension of a familiar framework

The idea of adapting the BSC for sustainability is not new; the “sustainability balanced scorecard” (SBSC) has been studied for over two decades. A 2025 bibliometric review of 247 publications on the subject found that the SBSC consistently strengthens organizations’ capacity to align sustainability goals with core strategic objectives, while also flagging persistent implementation barriers — chiefly, the difficulty of choosing sustainability indicators that are both meaningful and comparable across business units.

Sector-specific applications reinforce the pattern. A 2024 study of fast-moving consumer goods companies proposed a method for operationalizing ESG-adapted corporate strategy through the BSC’s four perspectives, translating climate and sustainability targets into the same cause-and-effect logic FMCG firms already use to manage financial and customer outcomes. Separate research on Indonesian manufacturing firms found that integrating ESG considerations into BSC design produced positive, statistically significant improvements in sustainability performance across all four scorecard dimensions — evidence that the framework does not need to be reinvented to absorb ESG, only extended.

It is not only a private-sector question

The pressure to link sustainability reporting to genuine strategic management extends beyond corporations. A 2025 study of local government organizations examined how municipalities are implementing ESG indicators within their balanced scorecards, finding that institutions incorporating sustainability into their performance frameworks — rather than treating it as a separate policy initiative — reported stronger policy coherence and citizen engagement. Leadership commitment and stakeholder participation emerged as the critical success factors, echoing what the private-sector research also finds: the framework only delivers value when it is genuinely used to manage strategy, not simply populated with new metrics.

The strategic risk of getting this wrong

None of this suggests ESG integration is straightforward. The same body of research is candid about where organizations struggle: selecting indicators that are material rather than merely available, avoiding a proliferation of metrics that dilutes strategic focus, and ensuring that sustainability targets are cascaded through the organization with the same discipline applied to financial ones.

That is precisely the discipline a well-designed Balanced Scorecard system is meant to enforce. The organizations best placed to meet ESG reporting obligations without derailing focus are, generally, the ones that already have a structured way of connecting objectives, KPIs and initiatives across the business — and are extending that same structure to sustainability, rather than building a parallel system for it.

Building the capability

As reporting requirements tighten and stakeholders — investors, regulators, customers — expect sustainability performance to be managed with the same rigor as financial performance, the ability to design and cascade a scorecard that genuinely integrates ESG becomes a strategic capability, not an accounting task.

The Certified Balanced Scorecard Management System Professional program from The KPI Institute equips participants to design, implement and cascade a Balanced Scorecard system built to hold up under exactly this kind of pressure — where strategy, KPIs and reporting obligations all need to move as one.

An all-in-one course for leaders and professionals: Executive Program in Strategy and Performance

April 24th, 2026 Posted by Business Education, Career Growth, Certifications, Courses, Professional Development 0 thoughts on “An all-in-one course for leaders and professionals: Executive Program in Strategy and Performance”

strategy and performance management cours Organizations often face a familiar problem.

Strategy plans exist, yet results fall short.

The Executive Program in Strategy and Performance by The KPI Institute responds to this gap through a structured learning experience designed for professionals in leadership and advisory roles.

The holistic program leads to a Graduate Certificate in Strategy and Performance, which focuses on core areas such as planning, performance measurement, data analysis, and execution practices. It runs across two semesters over 12 months. Participants complete four mandatory courses and a final practitioner portfolio built on 20 assignments tied to real business scenarios.

The integrated curriculum reflects the practical demands of a strategy and performance management course. Participants work through business planning, KPI selection, performance system design, and agile execution practices. Each course combines live online sessions with individual assignments and guided exercises. The final portfolio requires direct application of concepts in a real organizational context.

The learning format allows flexibility. Professionals can choose course dates based on their schedule. Each session brings a mix of participants from different industries and regions, which supports discussion grounded in varied experience.

What participants gain from the program

This sought-after program combines structured learning with access to tools and research. Participants receive a mix of course materials, applied exercises, and supporting resources that extend beyond the classroom.

Key components include:

  • Four certification courses delivered online
  • Pre-course and post-course assignments for each module
  • A final practitioner portfolio based on real case application
  • Access to toolkits, templates, and documented practices
  • A 12-month premium subscription to smartKPIs.com

Participants also receive four individual certifications, alongside the graduate certificate:

  • Certified Strategy and Business Planning Professional
  • Certified KPI Professional
  • Certified Performance Management Professional
  • Certified Agile Strategy Execution Professional

Facilitators bring both academic and consulting experience, with many involved in advisory work or executive roles. This background supports discussions grounded in real organizational challenges.

The program is designed for professionals who work closely with strategy and performance topics, including executives, consultants, business analysts, and managers of small and mid-sized organizations.

Program structure and next steps

The Graduate Certificate in Strategy and Performance includes:

  • Duration of 12 months across two semesters
  • Four mandatory courses
  • A final practitioner portfolio with 20 assignments
  • Evaluation based on coursework and portfolio completion

The Executive Program in Strategy and Performance also includes a postgraduate diploma track for those who want extended study and additional coursework. For a complete overview of the program, including courses and assessment, access the TKI-Graduate-Program-in-Strategy-and-Performance-Course-Brochure-2026.

For enrollment details, contact the ExEdu Advisory Team at exeduoffice@kpiinstitute.com

Still not upskilling? 22 skills you’re already falling behind on

April 21st, 2026 Posted by Certifications, Courses, Professional Development, Upskilling 0 thoughts on “Still not upskilling? 22 skills you’re already falling behind on”

Upskilling is no longer a career advantage reserved for ambitious professionals.

It has become a baseline expectation across industries.

In strategy, performance management, analytics, and execution, the gap between knowledge and application is widening. Professionals who fail to continuously upgrade their capabilities risk becoming disconnected from the very systems they operate in.

At The KPI Institute, this shift is not just observed—it is actively addressed through structured, research-based learning pathways designed to support real-world application. 

And as part of its 22nd anniversary celebration, professionals can also access 22% off all online courses, pre-recorded programs, and ExEdu certifications, making this an ideal moment to re-evaluate skill readiness.

Below are 22 skills that are quietly defining who moves forward—and who falls behind.

1. Strategic Direction Design

It is the ability to define long-term organizational direction in a way that aligns ambition with measurable intent. It is increasingly critical in environments where clarity determines competitiveness.

In fact, The KPI Institute’s Certified Strategy and Business Planning Professional and Practitioner connects this concept to structured frameworks that help professionals translate vision into executable direction.

2. Corporate Identity Formulation

It is about shaping mission, values, and organizational purpose into a coherent strategic identity. It influences how decisions are made and how organizations position themselves in the market. This capability is reinforced in structured strategy planning programs that help professionals connect identity with execution reality.

3. Strategy Planning Architecture

Professionals should be able to build structured systems that transform strategic intent into actionable plans across business units. This skill ensures alignment between leadership thinking and operational delivery. The KPI Institute’s Certified Strategy and Business Planning Professional and Practitioner anchors this capability in practical planning methodologies used in real organizational contexts.

4. Competitive Strategy Selection

Can you evaluate internal strengths and external conditions to determine how an organization competes effectively? Competitive strategy selection directly shapes long-term positioning and resilience. This skill is essential in strategy formulation practices where decision quality determines market relevance.

5. Strategy Communication Design

Do you have the resources to ensure that strategic priorities are clearly understood across all levels of an organization? Having practical knowledge in strategy communication design reduces misalignment and improves execution consistency. In the Certified Strategy and Business Planning Professional and Practitioner course, the skill is integrated into structured communication planning approaches that support organizational alignment.

6. Agile Strategy Adaptation

It is the ability to adjust strategic initiatives in response to changing conditions without losing overall direction. It has become essential in volatile business environments. The KPI Institute connects this capability to agile methodologies designed for real-time strategic responsiveness.

7. Strategic Execution Alignment

This skill is about ensuring that teams, initiatives, and resources consistently support defined strategic priorities. It closes the gap between planning and delivery. This capability is central to modern execution frameworks where alignment determines performance outcomes.

8. KPI Design and Structuring

KPI design and structuring means defining meaningful indicators that accurately reflect performance and strategic priorities. It forms the backbone of performance measurement systems. The KPI Institute’s Certified KPI Professional and Practitioner course provides structured methodologies for designing KPIs that are relevant, measurable, and strategically aligned.

9. KPI Monitoring Systems

With a background and skill in KPI monitoring, you can establish processes that track performance continuously and highlight deviations from targets. This capability strengthens organizational accountability. It is crucial in data-driven environments where visibility drives decision-making.

10. KPI Interpretation for Decision-Making

KPI interpretation for decision-making is about transforming performance data into actionable insights that support strategic choices. It bridges measurement and action. To help professionals apply this, The KPI Institute’s Certified KPI Professional and Practitioner course embeds this skill in applied performance analysis frameworks used globally.

11. Performance Management System Design

Performance management system design refers to creating structured frameworks that connect organizational objectives with measurable outcomes across all levels. It ensures that performance is managed consistently rather than intuitively.

12. Organizational Performance Improvement

Professionals should be able to identify inefficiencies and implement structured interventions to enhance effectiveness. This capability strengthens execution capability across functions. The KPI Institute’s Certified Performance Management Professional course connects this to applied improvement frameworks used in real organizational environments.

13. Employee Performance Alignment

Employee performance alignment is about linking individual roles and outputs directly to organizational strategy. It improves clarity, accountability, and engagement. This skill is important in modern performance-driven organizations where alignment defines contribution quality.

14. Continuous Feedback Systems

Having a practical knowledge in continuous feedback systems can help one enable ongoing performance conversations between managers and employees rather than relying on annual reviews. It supports faster development cycles and more adaptive workforce performance.

15. Balanced Scorecard System Design

This is about translating strategy into a structured performance framework across financial and non-financial perspectives. In fact, The KPI Institute’s Certified Balanced Scorecard Management System Professional course aligns this methodology with practical implementation across organizational levels.

16. OKR Design and Structuring

OKR design and structuring: defining clear objectives and measurable key results that align teams toward shared priorities. It has become a widely adopted method for improving focus and execution clarity.

17. OKR Alignment and Review Cycles

OKR alignment and review cycles refer to continuously evaluating progress and ensuring objectives remain aligned across teams and functions. The KPI Institute’s Certified OKR Professional course embeds this into structured OKR governance and execution practices.

18. Data-Driven Decision Making

This is about using structured data insights to guide operational and strategic choices. It reduces reliance on intuition in complex environments. Professionals can learn the analytical foundation for evidence-based decision-making through The KPI Institute’s Certified Data Analysis course. 

19. Statistical Interpretation in Business

Do you understand patterns, relationships, and variability in data to support forecasting and evaluation? This capability strengthens analytical thinking in performance and strategy contexts.

20. Data Visualization Design

Data visualization design means transforming complex datasets into clear, interpretable visual formats that support decision-making. The KPI Institute’s Certified Data Visualization Professional course links this to structured visual communication practices used in business reporting.

21. Benchmarking Methodology Application

This is a skill relevant to comparing performance against external standards or competitors to identify improvement opportunities. It is widely used to understand performance gaps and drive continuous improvement.

22. Performance Benchmarking Translation

Performance benchmarking translation is about converting comparative insights into structured improvement actions that enhance organizational performance. The KPI Institute’s Certified Benchmarking Professional course connects this to applied benchmarking systems used in performance optimization.

Wait, there’s more!

The KPI Institute is celebrating 22 years of excellence with a special anniversary deal. You can enjoy 22% off all online courses, pre-recorded programs, and ExEdu certifications. Read further details here.

KPI and business strategy courses

_____________________________________________________________________________________

The KPI Institute is a global leader in business performance research and solutions, specializing in practice domains including strategy, key performance indicators (KPIs), employee performance, customer service, and innovation management. For over 20 years, The KPI Institute has established international standards and best practices for KPIs across both private and public sectors.

What We Offer:

  • Certifications & Training: Practical programs delivered worldwide—live online, offsite, and customized—spanning 6 continents and 7 offices in Australia, Southeast Asia, Europe, and the Middle East.
  • Knowledge Platforms: Access to www.smartKPIs.com, the world’s largest documented database of KPIs, with over 21,600 examples published and 148,000+ members in our online communities.
  • Publications: Over 460 publications, including books, research papers, and practical guides, providing insights to enhance organizational performance.
  • Advisory & Implementation Support: Expert guidance to apply insights in practice for measurable impact.

Our Reach and Impact:

  • 81,000+ companies registered on our platforms
  • 2.5 million+ professionals reached through training and knowledge services
  • 128 research client countries and 120 global partner organizations 

Website: www.kpiinstitute.org.

Email: office@kpiinstitute.org

LinkedIn: The KPI Institute

business strategy online courses

5 must-know factors before investing in business strategy online courses

April 14th, 2026 Posted by Certifications, Courses 0 thoughts on “5 must-know factors before investing in business strategy online courses”

business strategy online courses

Choosing the right business strategy online course can be overwhelming, especially with so many programs claiming to deliver results.

At The KPI Institute, we’ve spent over 20 years working with professionals and organizations globally to refine frameworks, teaching methods, and practical tools that align with international standards in performance and strategy management.

Before investing your time and money, consider the following research-backed factors.

They highlight what actually contributes to meaningful learning outcomes and long-term professional value.

And they’re the kinds of experiences that our own Certified Strategy and Business Planning Professional program is built to provide.

1. Check whether you’ll be practicing, not just listening

Research consistently shows that active learning, including case studies, simulations, and applied exercises, leads to better understanding, retention, and real-world application than passive lecture formats. A meta-analysis in Frontiers in Education found that active learning significantly improves performance outcomes compared to traditional instruction.

To identify hands-on courses, review the syllabus for practical exercises, scenario work, templates, and collaborative projects.

The KPI Institute’s Certified Strategy and Business Planning Professional program integrates real-world strategic exercises, giving learners opportunities to apply concepts directly to challenges they face in their organizations.

2. Scrutinize the credibility of the provider

Reputation and institutional legitimacy matter because they signal quality, standards, and trustworthiness—attributes both learners and employers pay attention to when evaluating credentials. Research on micro‑credentials finds that employers use the source of a credential as part of their assessment of its value, showing that credentials issued by recognized institutions are more likely to be valued in hiring decisions.

Credibility ensures that the course content is rigorous, relevant, and aligned with international benchmarks.

The KPI Institute’s decades of experience with global organizations and practitioners ensures its programs reflect proven frameworks and professional standards.

3. Verify Continuing Professional Development (CPD) credits

CPD credits are more than a bonus—they provide structured, recognized learning that supports career growth.

Research in professional learning contexts shows that CPD-accredited programs enhance reflection, skill application, and professional performance.

The Certified Strategy and Business Planning Professional program is CPD-accredited, meaning participants gain both practical skills and recognized professional development credits—strengthening their professional portfolio and demonstrating commitment to ongoing skill growth.

4. Look for reported professional impact and skill development

Testimonials and peer feedback matter. When evaluating a program, focus on whether alumni describe how they applied frameworks, solved organizational challenges, or improved decision-making.

The Certified Strategy and Business Planning Professional program consistently receives feedback from professionals reporting improved strategic clarity, planning confidence, and actionable results in their organizations:

“The comprehensive curriculum coupled with engaging, real-world case studies provided by our knowledgeable instructor gave me a deeper understanding of strategic frameworks and their practical applications. I particularly appreciated the interactive sessions, which were not only informative but also stimulating. Collaborating with peers from various backgrounds enriched the experience, offering diverse insights into strategic challenges. This course has significantly enhanced my strategic thinking and planning abilities, making it an invaluable part of my professional development. Highly recommended for anyone looking to elevate their strategic management skills!”
— Ramy AbuElEla
Associate Director, KPMG

“The Strategy and Business Planning Professional course offered a comprehensive and practical approach to understanding the fundamentals of strategy and business planning. The content was well-structured, with a perfect balance between theoretical concepts and real-world applications. Each module built on the previous one, providing clear insights into strategy formulation, implementation, and performance evaluation. The case studies and interactive activities made the learning experience engaging and immediately applicable to professional settings. I now feel equipped with the tools and knowledge to develop effective business strategies with confidence.”
— Amal Alhamazany
Assistant Professor, University of Hail (Saudi Arabia)

“Attending the KPI Institute’s 3-day session in Kuala Lumpur was a transformative experience. The practical and actionable learning has already proven its value in my work as a business consultant. The course served as a strong validation of my professional expertise, and I now feel immensely confident in my ability to deliver results in this area moving forward.”
— Bimal Kandel
Managing Director, Froxjob

“As a Lead Budget Analyst, I often work with the numbers behind the strategy. This course provided the perfect framework to understand the ‘why’ behind those numbers. The deep dive into Deliberate Strategic Planning and the practical application of KPIs has given me a stronger toolkit to align our financial planning with the organization’s long-term objectives. Highly recommended for finance professionals looking to think more strategically.”
— Abdullah Adel A Alsuhaimi
Lead Budget Analyst, STC

“This training program exceeded my expectations in terms of the depth of information and the practical skills included in the training material. In addition, the trainer demonstrated exceptional competence and extensive experience in the field. I highly recommend my colleagues to join this course whenever the opportunity arises, as it opens up many avenues for both personal and professional development.”
— Yousif Al-Nas
HR Consultant & Professional Coach, Planning & Programming Supervisor (Retired from Saudi Aramco)

5. Make sure the course uses technologically advanced tools

Technology isn’t just the delivery channel. It’s part of how you learn.

Research on interactive and adaptive learning technologies shows that platforms that support personalization, problem solving, and real‑time interaction can improve engagement and performance compared with static, lecture‑style systems alone.

Evaluate whether the learning environment supports adaptive paths, practical simulations, performance tracking, and collaboration.

The Certified Strategy and Business Planning Professional program is delivered via Lerero, a science‑driven platform built on cognitive research that supports adaptive learning paths, performance insights, personalized interactions, and meaningful engagement—all elements research suggests can enhance learning outcomes.

Invest in learning that works today

The KPI Institute’s Certified Strategy and Business Planning Professional program brings these five factors to life.

Experience it firsthand—secure your slot here.

KPI and business strategy courses

________________________________________________________________________________

The KPI Institute is a global leader in business performance research and solutions, specializing in practice domains including strategy, key performance indicators (KPIs), employee performance, customer service, and innovation management.

For over 20 years, The KPI Institute has established international standards and best practices for KPIs across both private and public sectors.

What We Offer:

  • Certifications & Training: Practical programs delivered worldwide—live online, offsite, and customized—spanning 6 continents and 7 offices in Australia, Southeast Asia, Europe, and the Middle East.
  • Knowledge Platforms: Access to www.smartKPIs.com, the world’s largest documented database of KPIs, with over 21,600 examples published and 148,000+ members in our online communities.
  • Publications: Over 460 publications, including books, research papers, and practical guides, providing insights to enhance organizational performance.
  • Advisory & Implementation Support: Expert guidance to apply insights in practice for measurable impact.

Our Reach and Impact:

  • 81,000+ companies registered on our platforms
  • 2.5 million+ professionals reached through training and knowledge services
  • 128 research client countries and 120 global partner organizations 

Website: www.kpiinstitute.org.

Email: office@kpiinstitute.org

LinkedIn: The KPI Institute

Recent Comments

    Archives