The training challenge many organizations are trying to solve
June 30th, 2026 Posted by Len Cristobal Business Education, Career Growth, Certifications, Courses, E-learning, Employees 0 thoughts on “The training challenge many organizations are trying to solve”
Finding time for professional development has become a familiar challenge across industries.
Teams need new skills to keep pace with changing business demands, yet many organizations also need employees to remain focused on day-to-day operations. Standard training programs can address broad topics, but they do not always reflect the realities of a specific industry, department, or business function.
Recent research points to a growing need for targeted workforce development.
The World Economic Forum’s Future of Jobs Report 2025, which remains one of the most widely referenced workforce studies in 2026, found that 59% of the global workforce will require training by 2030. The report also found that 63% of employers identify skills gaps as a major barrier to business transformation, while nearly 40% of current skill requirements are expected to change by 2030. The findings draw from responses submitted by more than 1,000 employers across 55 economies, representing over 14 million workers.
The need for workforce development also appears in learning and development research. LinkedIn Learning’s 2025 Workplace Learning Report, which continues to guide many learning strategies in 2026, found that 91% of learning and development professionals believe continuous learning has become more important than ever for career success, while organizations continue to look for learning programs that connect closely with business priorities.
These findings raise an important question:
How can organizations provide meaningful learning opportunities without disrupting business operations or asking employees to step away from work for several days?
One option comes through The KPI Institute’s customized live online group training programs, which combine live instruction with research-based content and practical application. Rather than following a standard curriculum, each program reflects the organization’s industry, functional area, and competency development requirements.
For over 20 years, The KPI Institute has advanced research and professional solutions in business performance worldwide, with expertise in strategy, key performance indicators (KPIs), employee performance, customer service, and innovation management.
When customized group training makes sense
A customized learning program may suit organizations that:
- Need examples and case studies that reflect their own industry.
- Want teams to build knowledge together instead of training employees individually.
- Need learning schedules that fit around operational commitments.
- Seek consistent knowledge across departments, business units, or regional offices.
- Want to address specific competency gaps through focused learning.
The delivery format also gives organizations greater flexibility. Sessions can take place over consecutive days within one week or across selected days over two or more weeks. Each session lasts up to four hours, which gives participants time to attend training while continuing with their regular responsibilities.
What participants can expect
The KPI Institute’s customized live online group training programs include:
- Flexible scheduling
Organizations select a schedule that aligns with business requirements and team availability. - Customized course content
Course materials, case studies, and practical exercises reflect the group’s industry, business functions, and learning priorities. - Business continuity
Four-hour sessions allow participants to continue with daily responsibilities while attending live instruction. - Virtual collaborative learning
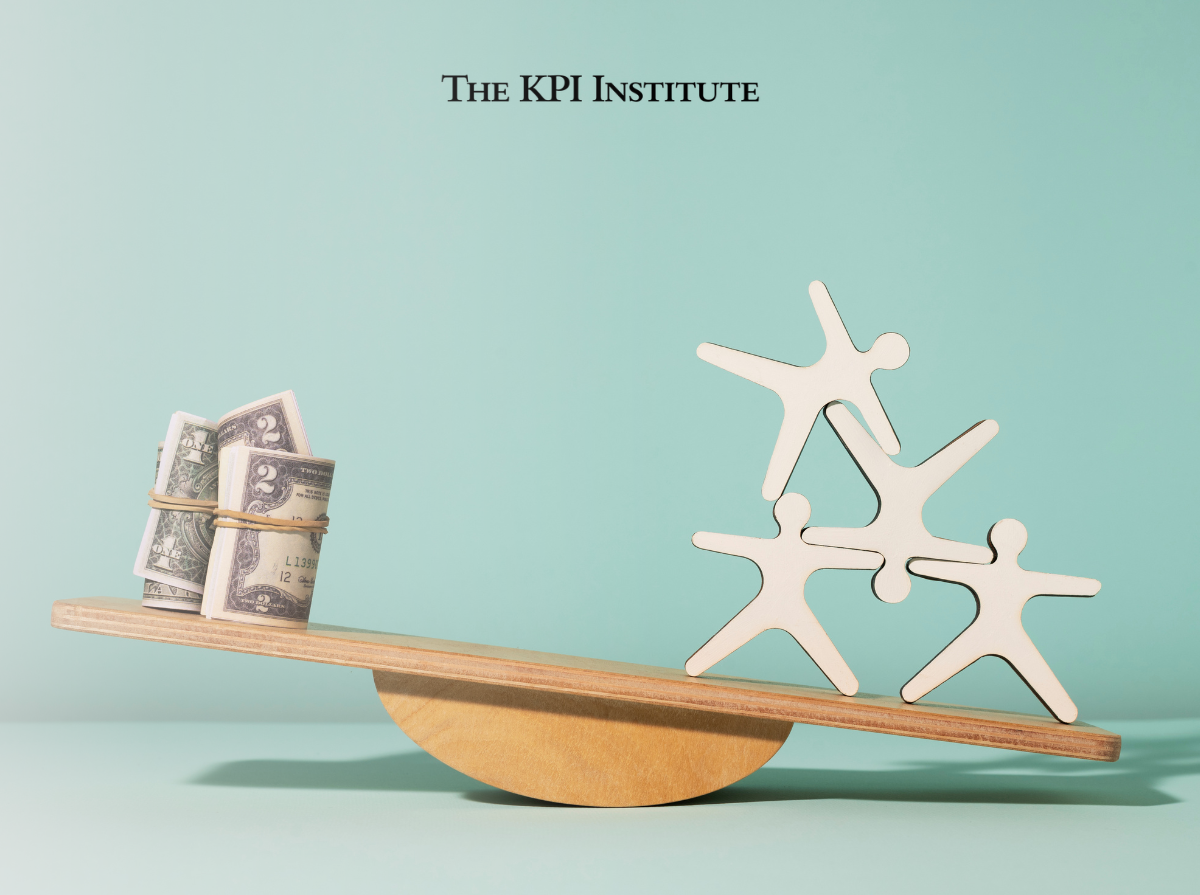
Interactive discussions, group activities, and digital collaboration tools encourage knowledge sharing throughout the program. - Cost efficiency
Organizations can save up to 40% compared with traditional face-to-face in-house training because travel, accommodation, venue, and other logistical costs do not apply.
Learning topics available for customization
Organizations can customize live online training across The KPI Institute’s professional learning portfolio:
- Certified KPI Professional and Practitioner
Learn how to select, document, monitor, and report Key Performance Indicators that support organizational objectives. - Certified OKR Professional
Build practical knowledge on designing and implementing Objectives and Key Results across teams. - Certified Strategy and Business Planning Professional
Study frameworks and methods used to develop and execute strategic and business plans. - Certified Performance Management Professional
Explore approaches to organizational performance measurement, reporting, and decision-making. - Certified Strategy and Performance Maturity Assessment Professional
Assess the maturity of performance management systems through structured methodologies. - Certified Employee Performance Management Professional
Examine performance planning, employee evaluation, coaching, and development practices. - Certified Data Analysis Professional
Develop skills for collecting, analyzing, and interpreting business data. - Certified Data Visualization Professional
Present complex information through dashboards, charts, and visual reporting techniques. - Certified Benchmarking Professional
Learn structured benchmarking methods to compare practices and performance with industry peers. - Certified Balanced Scorecard Management System Professional
Understand the Balanced Scorecard framework and its application in strategy execution. - Certified Agile Strategy Execution Professional
Explore agile practices that support strategy implementation in changing business environments.
Organizations may also choose the learning format that best fits their objectives:
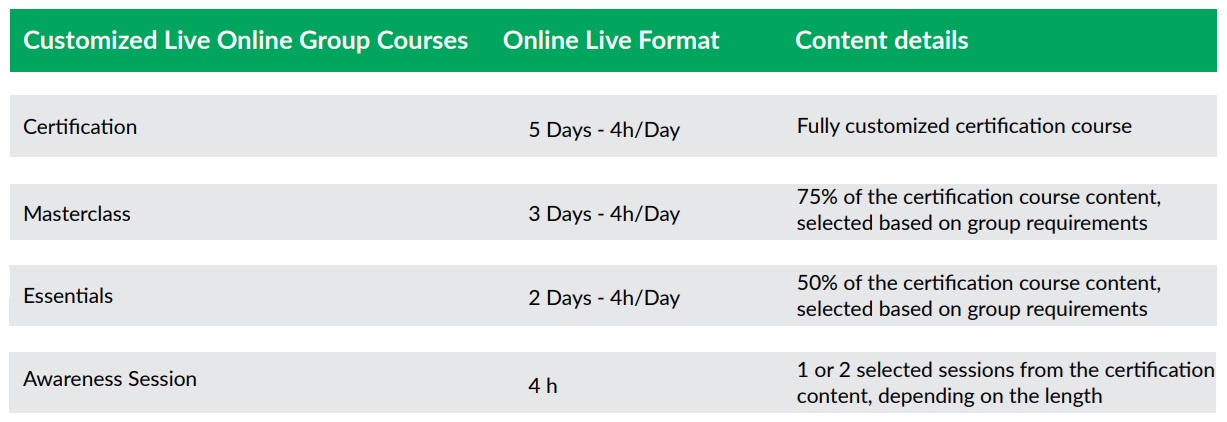
For more than 20 years, The KPI Institute has supported professionals and organizations through research, consulting, audit services, publications, and training in strategy and performance management. The customized live online group training programs add another learning option for organizations that want training built around their own priorities, people, and schedules.
Learn more
Organizations interested in arranging a customized live online group training program can contact the regional representative below.
Middle East
Teodora Gorski
Managing Director, MENA
E: teo.gorski@kpiinstitute.com
M: +971 55 787 6427
_____________________________
Asia Pacific
Sasikala Annamalai
Sales Director, Southeast Asia
E: sasikala.annamalai@kpiinstitute.com
M: +60 12 591 1366
_____________________________
Rest of the World
Alexandru Muntean
Head of Customer Engagement
E: alex.muntean@kpiinstitute.com
M: +40 747 060 997
__________________________________________________________________________________________
The KPI Institute is a global leader in business performance research and solutions, specializing in practice domains including strategy, key performance indicators (KPIs), employee performance, customer service, and innovation management. For over 20 years, The KPI Institute has established international standards and best practices for KPIs across both private and public sectors.
What We Offer:
- Certifications & Training: Practical programs delivered worldwide—live online, offsite, and customized—spanning 6 continents and 7 offices in Australia, Southeast Asia, Europe, and the Middle East.
- Knowledge Platforms: Access to www.smartKPIs.com, the world’s largest documented database of KPIs, with over 21,600 examples published and 148,000+ members in our online communities.
- Publications: Over 460 publications, including books, research papers, and practical guides, providing insights to enhance organizational performance.
- Advisory & Implementation Support: Expert guidance to apply insights in practice for measurable impact.
Our Reach and Impact:
- 81,000+ companies registered on our platforms
- 2.5 million+ professionals reached through training and knowledge services
- 128 research client countries and 120 global partner organizations
Website: www.kpiinstitute.org
Email: office@kpiinstitute.org
LinkedIn: The KPI Institute