Top KPIs every hospitality and tourism professional should track in 2025
August 20th, 2025 Posted by Paolo Orduna KPIs 0 thoughts on “Top KPIs every hospitality and tourism professional should track in 2025”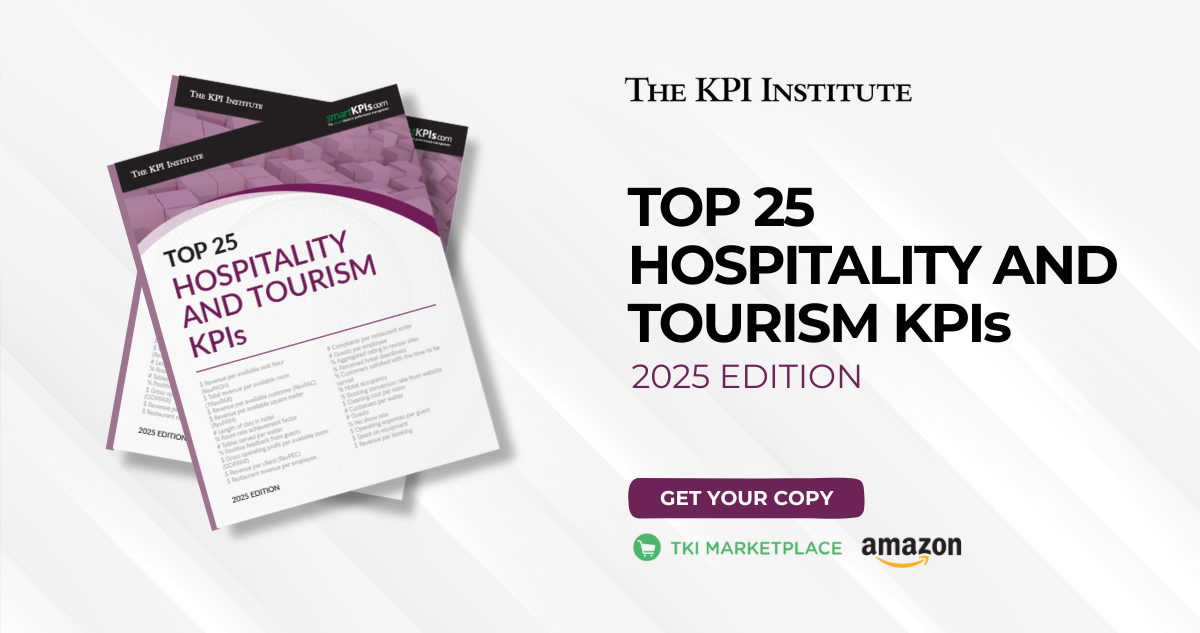
In 2025, the global travel and tourism industry is projected to contribute USD 11.7 trillion to the world’s GDP, which represents more than 10% of the global economy, and support over 371 million jobs worldwide. The continued rise in international visitor spending, combined with ongoing digital transformation, underscores the need for data-driven decision-making across all levels of the sector.
In this context, performance measurement has become increasingly important. As technological advancements transform service delivery and customer expectations continue to change, key performance indicators (KPIs) may serve as crucial tools for managing financial results, improving guest experiences, optimizing service operations, and controlling costs.
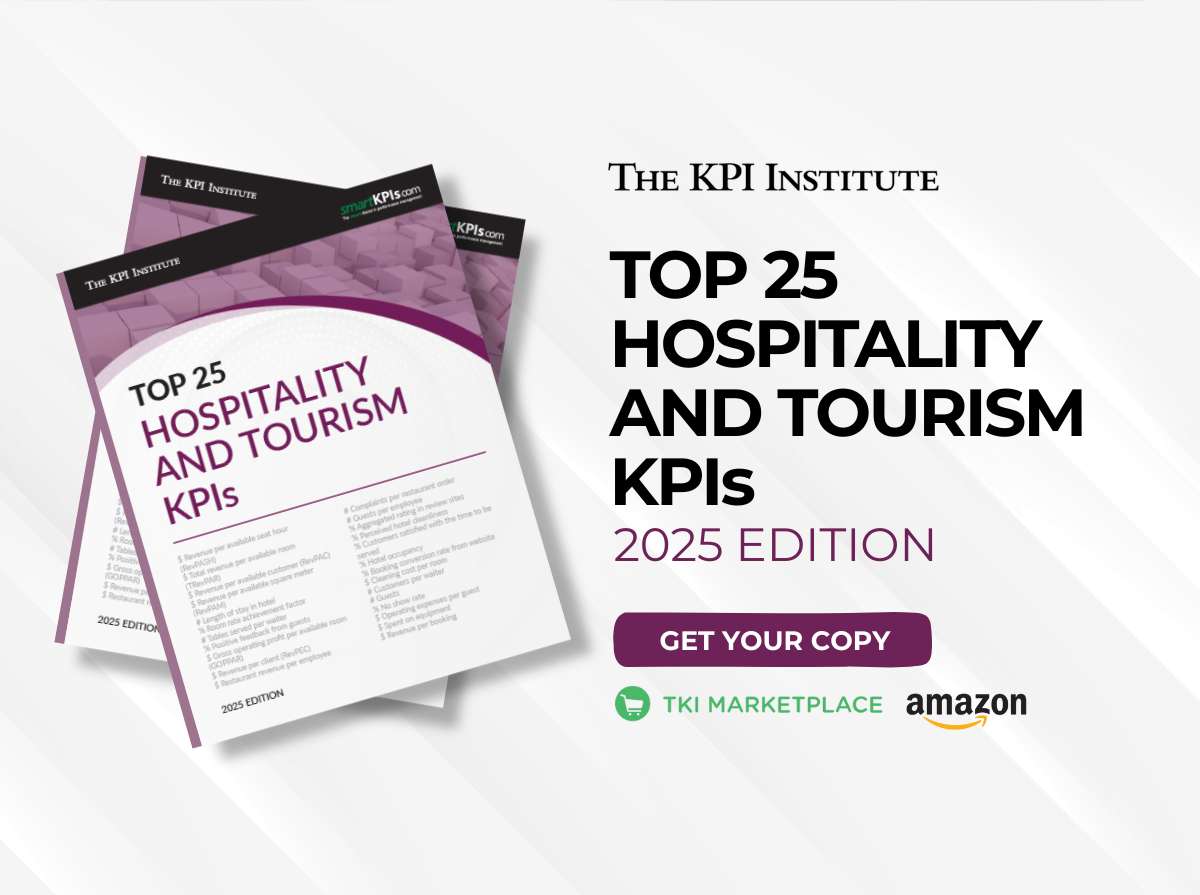
To support hospitality professionals in navigating such developments, The KPI Institute has released the Top 25 Hospitality and Tourism KPIs – 2025 Edition. This publication highlights the most impactful KPIs based on global usage and relevance to industry practice. Whether it’s evaluating revenue per available seat hour or monitoring available square meter utilization, the report offers practical insights for professionals as they align performance measurement with organizational goals. To provide a glimpse into the report, here are five of the top KPIs included in the 2025 edition:
- $ Revenue per available seat hour (RevPASH): Measures the amount of revenue earned for each available seat per hour of operation. This KPI helps managers identify peak usage times and adjust pricing or staffing to maximize revenue.
- $ Total revenue per available room (TRevPAR): Measures the total revenue earned per available room, accounting for both room sales and additional services offered by the hotel. By tracking this KPI, hotels can better understand revenue sources and adjust pricing and sales tactics accordingly.
- $ Revenue per available customer (RevPAC): Measures the average amount of revenue generated from each customer over the reporting period. Understanding customer spending patterns and customer types through RevPAC can guide marketing and service strategies.
- $ Revenue per available square meter (RevPAM): Measures the revenue generated per square meter from non-room areas within a hotel, including workspaces, parking, meeting rooms, and event venues. This KPI reveals which areas generate the most revenue, helping managers decide where to better allocate resources.
- # Length of stay in hotel: Measures the average duration of a guest’s stay in terms of nights spent at the hotel. This KPI can provide insights into guest stay patterns to help hotels adjust pricing, manage room availability, or plan staff schedules more efficiently.
This report is part of the Top 25 KPIs – 2025 series developed by The KPI Institute. The series explores the application of the performance measurement framework and addresses challenges related to effective KPI implementation. It also features updated content and enhanced documentation form templates that present the most relevant information for each KPI to facilitate understanding, communication, and integration within performance management systems.
Explore the full report to gain valuable insights and enhance your organization’s performance measurement practices today. The Top 25 Hospitality and Tourism KPIs – 2025 Edition is now available for purchase via the TKI Marketplace. A printed version can also be ordered on Amazon. Get your copy today!