Monthly Archives: April, 2025

Performance Magazine’s new edition explores impact of culture on employee performance

April 30th, 2025 Posted by Publications 0 thoughts on “Performance Magazine’s new edition explores impact of culture on employee performance”

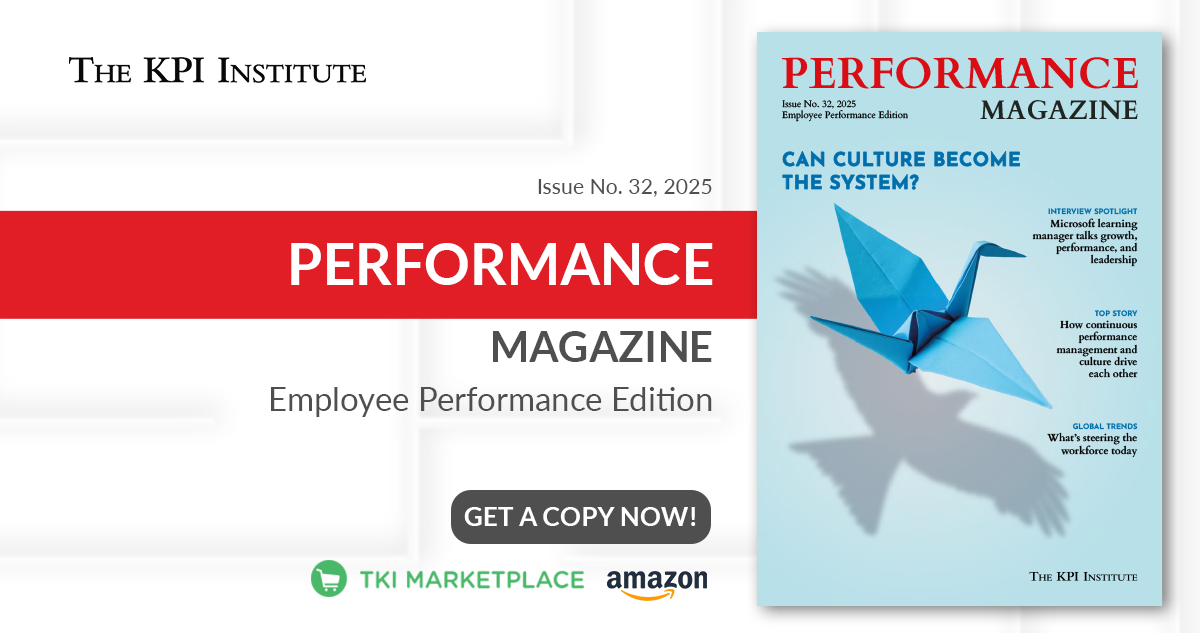
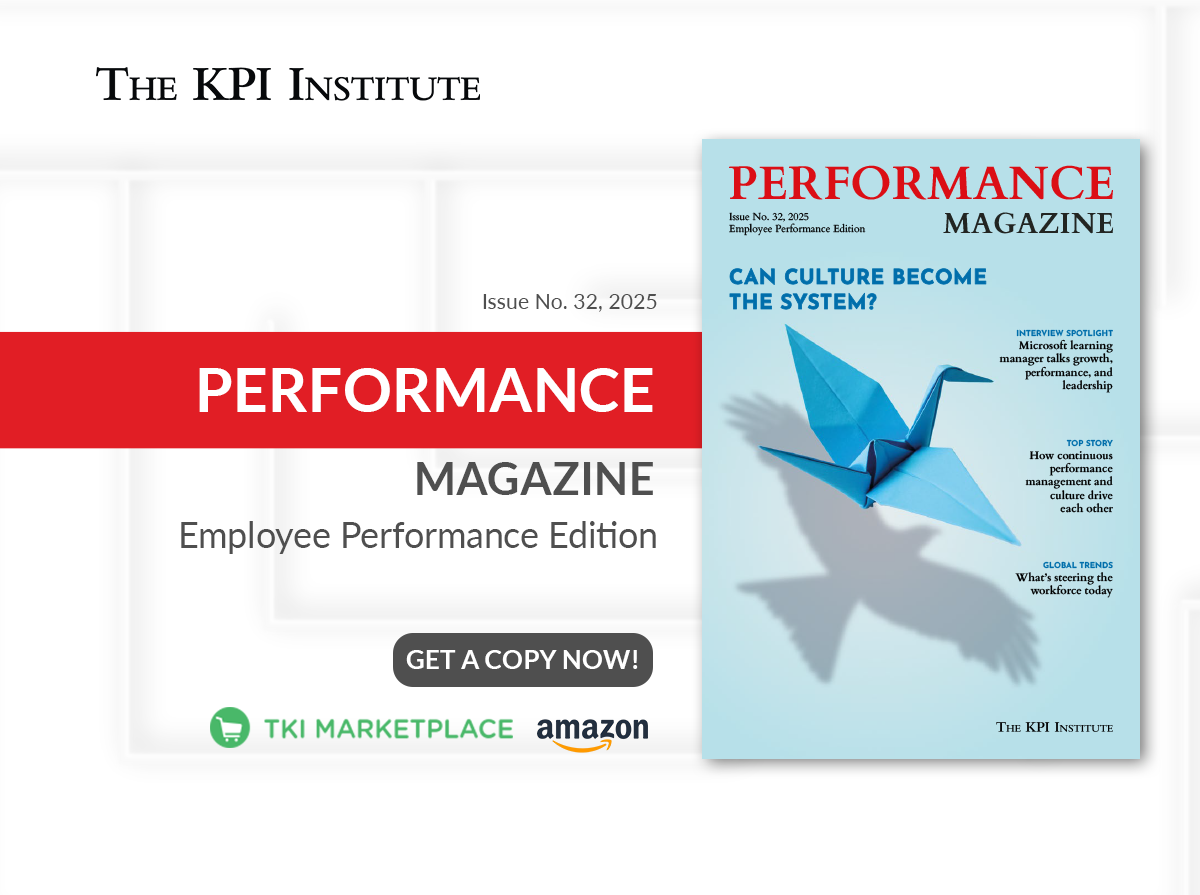
Performance Magazine, the business publication of The KPI Institute, proudly announces the release of its Employee Performance Edition. This issue highlights how organizational culture drives employee performance and strengthens workplace engagement across various dimensions. Culture is increasingly recognized as a core driver of success, influencing how employees work, interact, and contribute to company objectives. The edition explores how cultural values can be applied to create environments where high performance is integrated into daily operations.

The cover story, “When Culture Becomes the System: How Continuous Performance Management Transforms Today’s Organizations,” discusses how continuous performance management systems, when aligned with cultural values, lead to more effective and consistent results. By embedding these principles into everyday activities, organizations can better align teams with business objectives and boost overall performance.

This edition also explores key trends transforming the workplace, including shifts in employee benefits, engagement, and satisfaction. It addresses the impact of phenomena like “The Great Detachment,” “dry promotions,” and presenteeism. It also examines the return-to-office debate, the influence of microcultures within teams, and the need for global organizations to build adaptive cultures that connect diverse employee backgrounds, support collaboration, and promote quick decision-making in a fast-changing world.

Interviews with industry leaders offer insights into creating a performance-oriented culture, highlighting the importance of transparency, collaboration, and trust in guiding organizational behavior. They also highlight how performance evaluations are shifting toward a greater focus on results, moving away from traditional ratings. The discussion also touches on sustainability’s role in organizational culture, emphasizing its value as a core principle rather than just a regulatory requirement.

As Performance Magazine celebrates its 10th anniversary, this edition marks the first issue of the year and kicks off a year-long celebration of a decade of leadership in performance management.

The digital version of Performance Magazine’s Employee Performance Edition is available for free on the TKI Marketplace, while the print version can be purchased on Amazon.

The Top 25 Oil and Gas KPIs Report has arrived: what’s inside the first edition of the 2025 series?

April 16th, 2025 Posted by KPIs 0 thoughts on “The Top 25 Oil and Gas KPIs Report has arrived: what’s inside the first edition of the 2025 series?”

From powering vehicles on daily commutes to fueling airplanes across continents, from heating homes during cold seasons to generating electricity that lights up cities, oil and gas are deeply embedded in life. Even the production and transport of countless everyday items depend on these energy sources—we rely on them to keep the world moving and growing.

The oil and gas industry is one of the largest sectors in the world in terms of dollar value. According to IBISWorld, the industry generated an estimated $4.2 trillion in global revenue by the end of 2024. This reflects a compound annual growth rate (CAGR) of 6.0%, with a modest 1.9% increase recorded in 2024 alone. 

This sustained growth reflects not only global energy demand but also the industry’s ongoing shift toward digital transformation. As oil and gas producers increasingly adopt advanced technologies like big data analytics and machine learning, the role of key performance indicators (KPIs) becomes even more vital. These innovations enhance exploration accuracy, boost production efficiency, reduce environmental impact, and generate vast performance data. Leveraging KPIs enables organizations to track these improvements, benchmark success, and make data-driven decisions that align with evolving energy demands and sustainability goals.

To support performance monitoring and strategic decision-making in the oil and gas industry, The KPI Institute has released the Top 25 Oil and Gas KPIs – 2025 Edition, the first report of the Top 25 KPIs series in 2025. This report combines the most relevant and widely used KPIs across the sector to offer valuable insights into operational efficiency, financial performance, safety, and sustainability. Whether for benchmarking, performance improvement, or aligning with industry best practices, the KPIs featured in this edition serve as essential tools for navigating the complexities of the oil and gas industry in 2025 and beyond.

What’s inside the report?

While the Top 25 KPIs series has been ongoing, this marks the first dedicated oil and gas edition since 2018, which presents refreshed content, updated metrics, and a more refined structure that reflects the evolution of our reporting approach over the years.

The Top 25 Oil and Gas KPIs – 2025 Edition report offers practical guidance on how KPIs can enhance clarity, focus, and overall performance. While they are a valuable starting point for identifying relevant KPIs, these reports are not intended as definitive solutions. Instead, they represent the most popular KPIs based on smartKPIs.com data and user engagement.

This report is designed for practitioners, academics, and consultants involved in performance management. It covers the basics of KPIs, such as explaining key terminology and their application across organizations to drive performance, highlighting KPIs’ role in the Performance Measurement Framework, and exploring the governance structures that will ensure effective management.

Furthermore, the report features an updated two-page KPI Documentation Form template, including refined fields based on The KPI Institute’s latest research. It also offers practical tips for KPI reporting and visual examples of scorecards and dashboards to support real-world applications.

For a quick overview, here are the top five KPIs from Top 25 Oil and Gas KPIs – 2025 Edition report:

  1. % Drilling rig utilization rate – Tracks the percentage of time an operational drilling rig is actively in use compared to the total time it is available for drilling activities.
  2. % Non productive drilling time (NPT) – Measures the percentage of time when drilling operations are halted or the penetration rate is significantly low, relative to the total production time.
  3. # Process leaks identified during operation or downtime – Quantifies the number of unintended substance releases from industrial equipment or systems during operational phases or scheduled downtime within the reporting period.
  4. $ Drilling cost per meter – Determines the average cost of drilling per meter or foot of well drilled.
  5. % Drilling success rate –  Measures the percentage of exploration wells that successfully encountered oil and gas reserves, compared to the total number of exploration wells drilled

Now that you’ve had a glimpse of the top metrics, are you ready to take your performance to the next level? Explore the Top 25 Oil and Gas KPIs – 2025 Edition for a deeper dive into each featured KPI above, plus 20 more in the report. Unlock practical insights to enhance operations, boost efficiency, and stay ahead in a competitive industry. Download the full report today by visiting the TKI Marketplace. You can also purchase a physical copy via Amazon

Five must-know terms from The KPI Institute’s Data Visualization Glossary and their Arabic translations

April 9th, 2025 Posted by Publications 0 thoughts on “Five must-know terms from The KPI Institute’s Data Visualization Glossary and their Arabic translations”

Clear communication is the cornerstone of effective data visualization. However, the language we use to describe visual tools often suffers from ambiguity, especially when terms are translated without consideration of their intended function or context. Recognizing this challenge, The KPI Institute developed a Data Visualization Glossary, not just to define terms but to reimagine them for Arabic speakers in a way that preserves clarity and purpose.

In crafting the Arabic version of this glossary, The KPI Institute didn’t simply translate English terms word-for-word. Instead, they first refined the definition, distilling each term’s essence, and then created an Arabic equivalent that reflects the concept as clearly and familiarly as possible for native speakers. The result is a carefully cultivated glossary in which each Arabic term stands independently, free from being a mere counterpart to another language. 

Furthermore, the glossary is structured into three main sections for ease of use: Contextual Index, Terms and Definitions, and Arabic-English Index. This ensures readers can navigate the content intuitively, whether looking for a specific term or exploring broader concepts.

In this article, let’s dive into the five must-know terms from the glossary and how they’ve been thoughtfully translated into Arabic.

In the process—almost like starting from scratch—The KPI Institute took the opportunity to untangle the overlapping use of certain English terms often used interchangeably without clear distinctions. Terms like chart, graph, and diagram tend to blur into each other, leading to confusion. To bring clarity, here are the deliberate distinctions made by The KPI institute:


    • Chart – A visual representation that conveys values of qualitative or quantitative variables.

Context: Data reporting channels

رسم بياني – رسم يعبر عن قيم متغيرات نوعية أو كمية

السياق: وسائل عرض البيانات


    • Diagram – A conceptual drawing without qualitative or quantitative values, used to illustrate abstract ideas and concepts.

Context: Data reporting channels

مخطط نظري – رسم نظري لا يضم مرمزات لقيم نوعية أو كمية، يستخدم لتوضيح الأفكار والمفاهيم المجردة

السياق: وسائل عرض البيانات


    • Graph – Anything drawn for explanatory purposes, which may rely on data values as a chart or simply illustrate theoretical concepts as a diagram.

Context: Data reporting channels

رسم – أي شيء مرسوم بغرض التوضيح، قد يعتمد على قيم بيانية فيكون رسًًما بيانًًّيا، أو لا يعتمد إلّا على مفاهيم نظرية فيكون مخطّطًا نظريا

السياق: وسائل عرض البيانات


In addition, the glossary carefully distinguishes more commonly confused terms, such as the difference between grid and gridlines.


    • Grid – An imagined network of vertical and horizontal lines, visualizing them on the drawing space helps to divide it and distribute the design elements according to clear templates.

Context: Grid elements

شبكة الخلفية – شبكة متخيلة من خطوط عامودية وأفقية، يساعد تخيلها على فراغ الرسم على تقسيمه وتوزيع عناصر التصميم وفق قوالب واضحة

السياق: عناصر شبكة الخلفية

    • Gridlines – Vertical and horizontal lines on charts using the Cartesian system, extending from tick marks on the x and y-axes across the chart area. Gridlines aid in comparing data points to axis values and may be omitted if data values are directly labeled. 

Context: Data visualization elements

See also: Axis – Tick mark – Data label

خطوط الخلفية – خطوط رأسية وعامودية في الرسوم البيانية المعتمدة على النظام الديكارتي، تنطلق من علامات التجزئة على محوري السينات والصادات وتمتد لآخر مساحة التمثيل البياني. تفيد في تسهيل مقارنة مكان النقاط البيانية بقيم عالمات التجزئة. يفضل التخلص منها إن كانت النقاط البيانية يسهل معرفة قيمتها من دون مقارنتها بقيم عالمات التجزئة، غالًًبا باستبدال التوضيحات البيانية بها.

السياق: عناصر التصميم البياني

انظر أيضًا: محور، عالمة تجزئة، توضيح بياني


This clarification enhances precision in understanding and usage. To discover more essential terms and their contextual Arabic translations, explore the Data Visualization Glossary by The KPI Institute. It is available on the TKI Marketplace—download yours today!

Shape the future of strategy management, contribute to the 2025 report

April 2nd, 2025 Posted by Events 0 thoughts on “Shape the future of strategy management, contribute to the 2025 report”

Strategy management is not a one-time effort—it’s a continuous process of planning, alignment, execution, and adaptation. To stay ahead, organizations must constantly reassess their strategic direction, fine-tune their processes, and embrace innovation. As priorities shift and industries transform, the ability to manage strategy effectively becomes a defining factor for long-term success.

In the State of Strategy Management Practice—2024 MENA Region report, effective strategy planning requires balancing formal and informal approaches. It also reveals that successful organizations leverage data, artificial intelligence (AI), and tools to address evolving challenges. As organizations in the Middle East and North Africa (MENA) region navigate digital transformation and globalization, they face growing pressure to enhance agility, align key performance indicators (KPIs) with goals, and integrate sustainability and risk into their strategic efforts.

To better understand how organizations adapt and evolve their strategy management practices and to take an in-depth look at the MENA region, highlighting previous advancements, challenges, and areas for improvement across multiple industries, The KPI Institute is conducting its State of Strategy Management Practice survey for the fourth year. This research initiative explores trends and tracks progress in key areas such as strategic planning, execution, performance measurement, and organizational agility.

Built on your trust and valuable insights, the State of Strategy Management Practice report has evolved into a trusted and influential publication, widely referenced by strategy professionals and experts across various sectors. This year, The KPI Institute invites you to contribute to the 2025 edition of the report. The KPI Institute is reaching out to the professionals who drive strategy efforts daily in the MENA region. 

As a token of appreciation, all participants who complete the survey will receive the following exclusive products from our comprehensive library:

  • Top 25 Sustainability KPIs 2024 Edition (digital copy)
  • State of Strategy Management Practice 2024 MENA Region Report (digital copy)
  • Navigating the Landscape of Strategy Planning and Execution in the Era of Transformation – Webinar Q&A Brochure (digital copy)

Join The KPI Institute and contribute to the creation of another valuable resource for the global strategy management community. Take the survey now—click HERE! The survey is open until April 30, 2025.

For any inquiries about the survey or the report, please contact Agyar Hardjasudjana, a Business Research Analyst at The KPI Institute, via email: agyar.hardjasudjana@kpiinstitute.com

Recent Comments

    Archives