KPI news: The KPI Institute’s research shows today’s most popular KPIs
Reports featuring the most popular KPIs of 2022 are now all available at The KPI Institute’s Marketplace platform. This series covers different contexts in which KPIs can be used by professionals and offers up-to-date information and resources on selecting and using KPIs.
The most popular KPIs were processed based on the data from smartKPIs.com, the world’s largest database of documented KPIs. In every report, users will find a KPI profile, analysis, notes on KPI reporting, and other details pertaining to performance measurement.
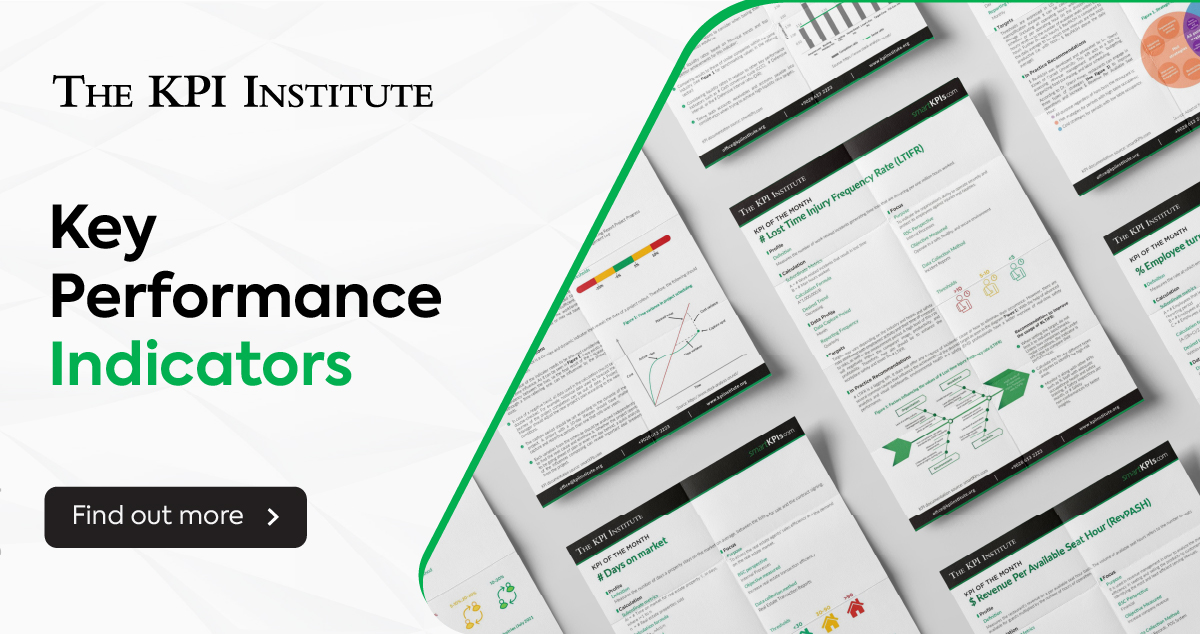
Explore the most popular KPIs in their respective industries or areas through the KPI of the Month poster collection, which can be downloaded for free:
KPI of January: # Days on market – measures the number of days a property stays on the market on average, between the listing for sale and the contract signing
KPI of February: # Berry ratio – measures the ratio of an organization’s gross profits to operating expenses
KPI of March: % Production First Time Yield (FTY) – measures the percentage of good units produced as per specifications from the first run of the process, out of the units going into the process
KPI of April: % Hospital bed occupancy rate – measures the percentage of beds in the hospital that are occupied by patients on a daily basis, out of the overall number of hospital beds
KPI of May: # Pick-to-ship cycle time for customer orders – measures the average time (in hours or days) from the moment of picking the order to the moment of shipping the product to the client
KPI of June: # Liquidity ratio – measures the available cash or other assets easily convertible into cash that could cover short term payables
KPI of July: % On time departures – measures the percentage of flights that are departing within 15 minutes from the initially scheduled take-off time out of the total number of flights scheduled for departing
KPI of August: % Project schedule variance – measures the variance in terms of schedule, revealing the alteration between the planned project timeframe and the actual project phase
KPI of September: % Production uptime – measures the percentage of the utilized operation time, from the planned available production time
KPI of October: % Employee turnover – measures the rate at which employees leave the organization in a given period
KPI of November: # Lost Time Injury Frequency Rate (LTIFR) – measures the number of work-related incidents generating time loss that are occurring per one million hours worked
KPI of December: $ Revenue Per Available Seat Hour (RevPASH) – measures the restaurant’s revenue on a per available seat hour basis.
For more information on the research reports, get in touch with Cristina Mihăiloaie, Business Unit Manager – Research Division: c.mihailoaie@kpiinstitute.com | +61 (390) 282 223 | +40 (749) 424 517