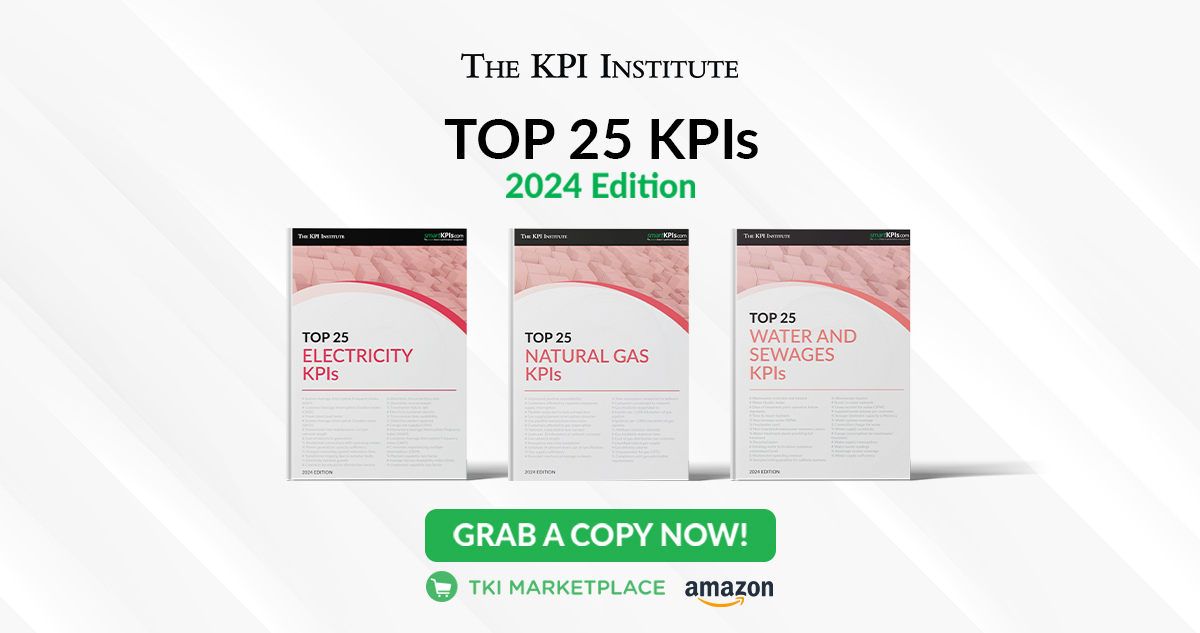
Top 25 KPIs for managing essential utilities: electricity, natural gas, and water and sewage

Utilities such as electricity, natural gas, and water and sewage services are the backbone of modern society, supporting everything from basic daily activities to critical infrastructure. Without these essential services, communities would struggle to function, and economies would come to a halt.
In the latest release of the Top 25 KPIs report series, The KPI Institute dives into the critical key performance indicators (KPIs) essential for managing vital utility services. As the demand for efficient and sustainable service delivery continues to rise, understanding and leveraging the right KPIs is more important than ever.
The Top 25 KPIs 2024 report series is an extensive collection of the 25 most commonly utilized KPIs from various industries and functional areas. The KPIs are curated based on viewership data from smartKPIs.com between January 2023 and April 2024, this series provides a snapshot of the latest trends in performance measurement.
Inside the report, readers can find a comprehensive analysis of the Performance Measurement Concept Framework, the most recent data on KPI challenges and usage contexts, and 10 strategies for successful KPI implementation. Moreover, each KPI featured has been thoroughly revised through extensive research to ensure that the information accurately captures the latest trends and changes in the evolving business environment. The 2024 edition also offers an enhanced documentation template that is optimized to present the most pertinent details about each KPI.
Whether readers are looking to enhance operational efficiency, reduce downtime, or deliver superior customer satisfaction, the Top 25 KPIs for utilities provide a comprehensive framework for driving performance improvements in this dynamic industry. In each report, let’s take a quick look at the top five KPIs for water and sewage, electricity, and natural gas.
Top 5 Water and Sewage KPIs
- # Wastewater collected and treated – measures the total volume of wastewater collected and treated in the reporting period
- # Water Quality Index – measures the quality of water based on five parameters – Temperature, Biological Oxygen Demand, Total Suspended Solids, Dissolved Oxygen, and Conductivity
- # Days of treatment plant operation below standards – measures the number of days during which the water treatment plant operates below established performance standards
- # Time to repair hydrants – measures the average time taken to repair a broken or inoperative hydrant
- % Non-revenue water (NRW) – measures the percentage of water that enters the distribution system but is lost before reaching customers and not billed, out of the volume of water supplied
Learn more about the practical applications of the indicators above, as well as the other top 20 KPIs for the water and sewage sector, grab a copy of the Top 25 Water and Sewage KPIs – 2024 Edition report. It is available for digital purchase via the TKI Marketplace and as a physical copy on Amazon.
Top 5 Electricity KPIs
- # System Average Interruption Frequency Index (SAIFI) – measures the average number of electricity system interruptions per customer during the reporting period
- # Customer Average Interruption Duration Index (CAIDI) – measures the average duration of electricity supply interruptions experienced by customers during the reporting period
- # Power plant load factor – measures the ratio of the average load to the peak load in the reporting period
- # System Average Interruption Duration Index (SAIDI) – measures the average duration of electricity supply interruptions per customer, during the reporting period
- $ Transmission line maintenance cost per network length – measures the average expenditures incurred with the maintenance of transmission lines relative to the length of the network
Explore more insights about the top 5 Electricity KPIs and other 20 indicators by purchasing the digital copy of the Top 25 Electricity KPIs – 2024 Edition, visit TKI Marketplace. Furthermore, a physical copy can be ordered via Amazon.
Top 5 Natural Gas KPIs
- # Unplanned pipeline unavailability – measures the duration, in hours, that a pipeline is not operational for transporting gas due to unplanned circumstances
- # Customers affected by repeated unplanned supply interruption – measures the number of customers impacted by multiple instances of unplanned supply interruption in the reporting
- # Pipeline subjected to leak surveys (km) – measures the length, in kilometers, of the gas pipeline network that was subjected to leak detection surveys in the reporting period
- # Gas supply planned interruptions duration – measures the average duration, in minutes, of planned gas supply interruptions experienced by customers in the reporting period
- # Gas pipeline temperature excursions – measures the number of gas pipeline temperature excursions recorded during a specified reporting period
Gain a deeper understanding of the practical use of the top 5 KPIs above and discover the other 20 Natural Gas KPIs. Download a digital copy of the Top 25 Natural Gas KPIs – 2024 Edition via TKI Marketplace or purchase another copy via Amazon.
As the demand for reliable, sustainable services continues to grow, understanding how to optimize utility operations is more critical than ever. Let the Top 25 KPIs 2024 report series from The KPI Institute serve as your guide in selecting the most critical KPIs and tracking your organization’s progress towards its strategic goals.


