Key Performance Indicators Infographic
KPIs or Key Performance Indicators are the selected measures that provide visibility into the performance of a business and enable decision makers to take action in achieving the desired outcomes. Typically, KPIs are monitored and distributed in dashboards or scorecards to provide everyone in the organization with an understanding of the strategy implementation progress.
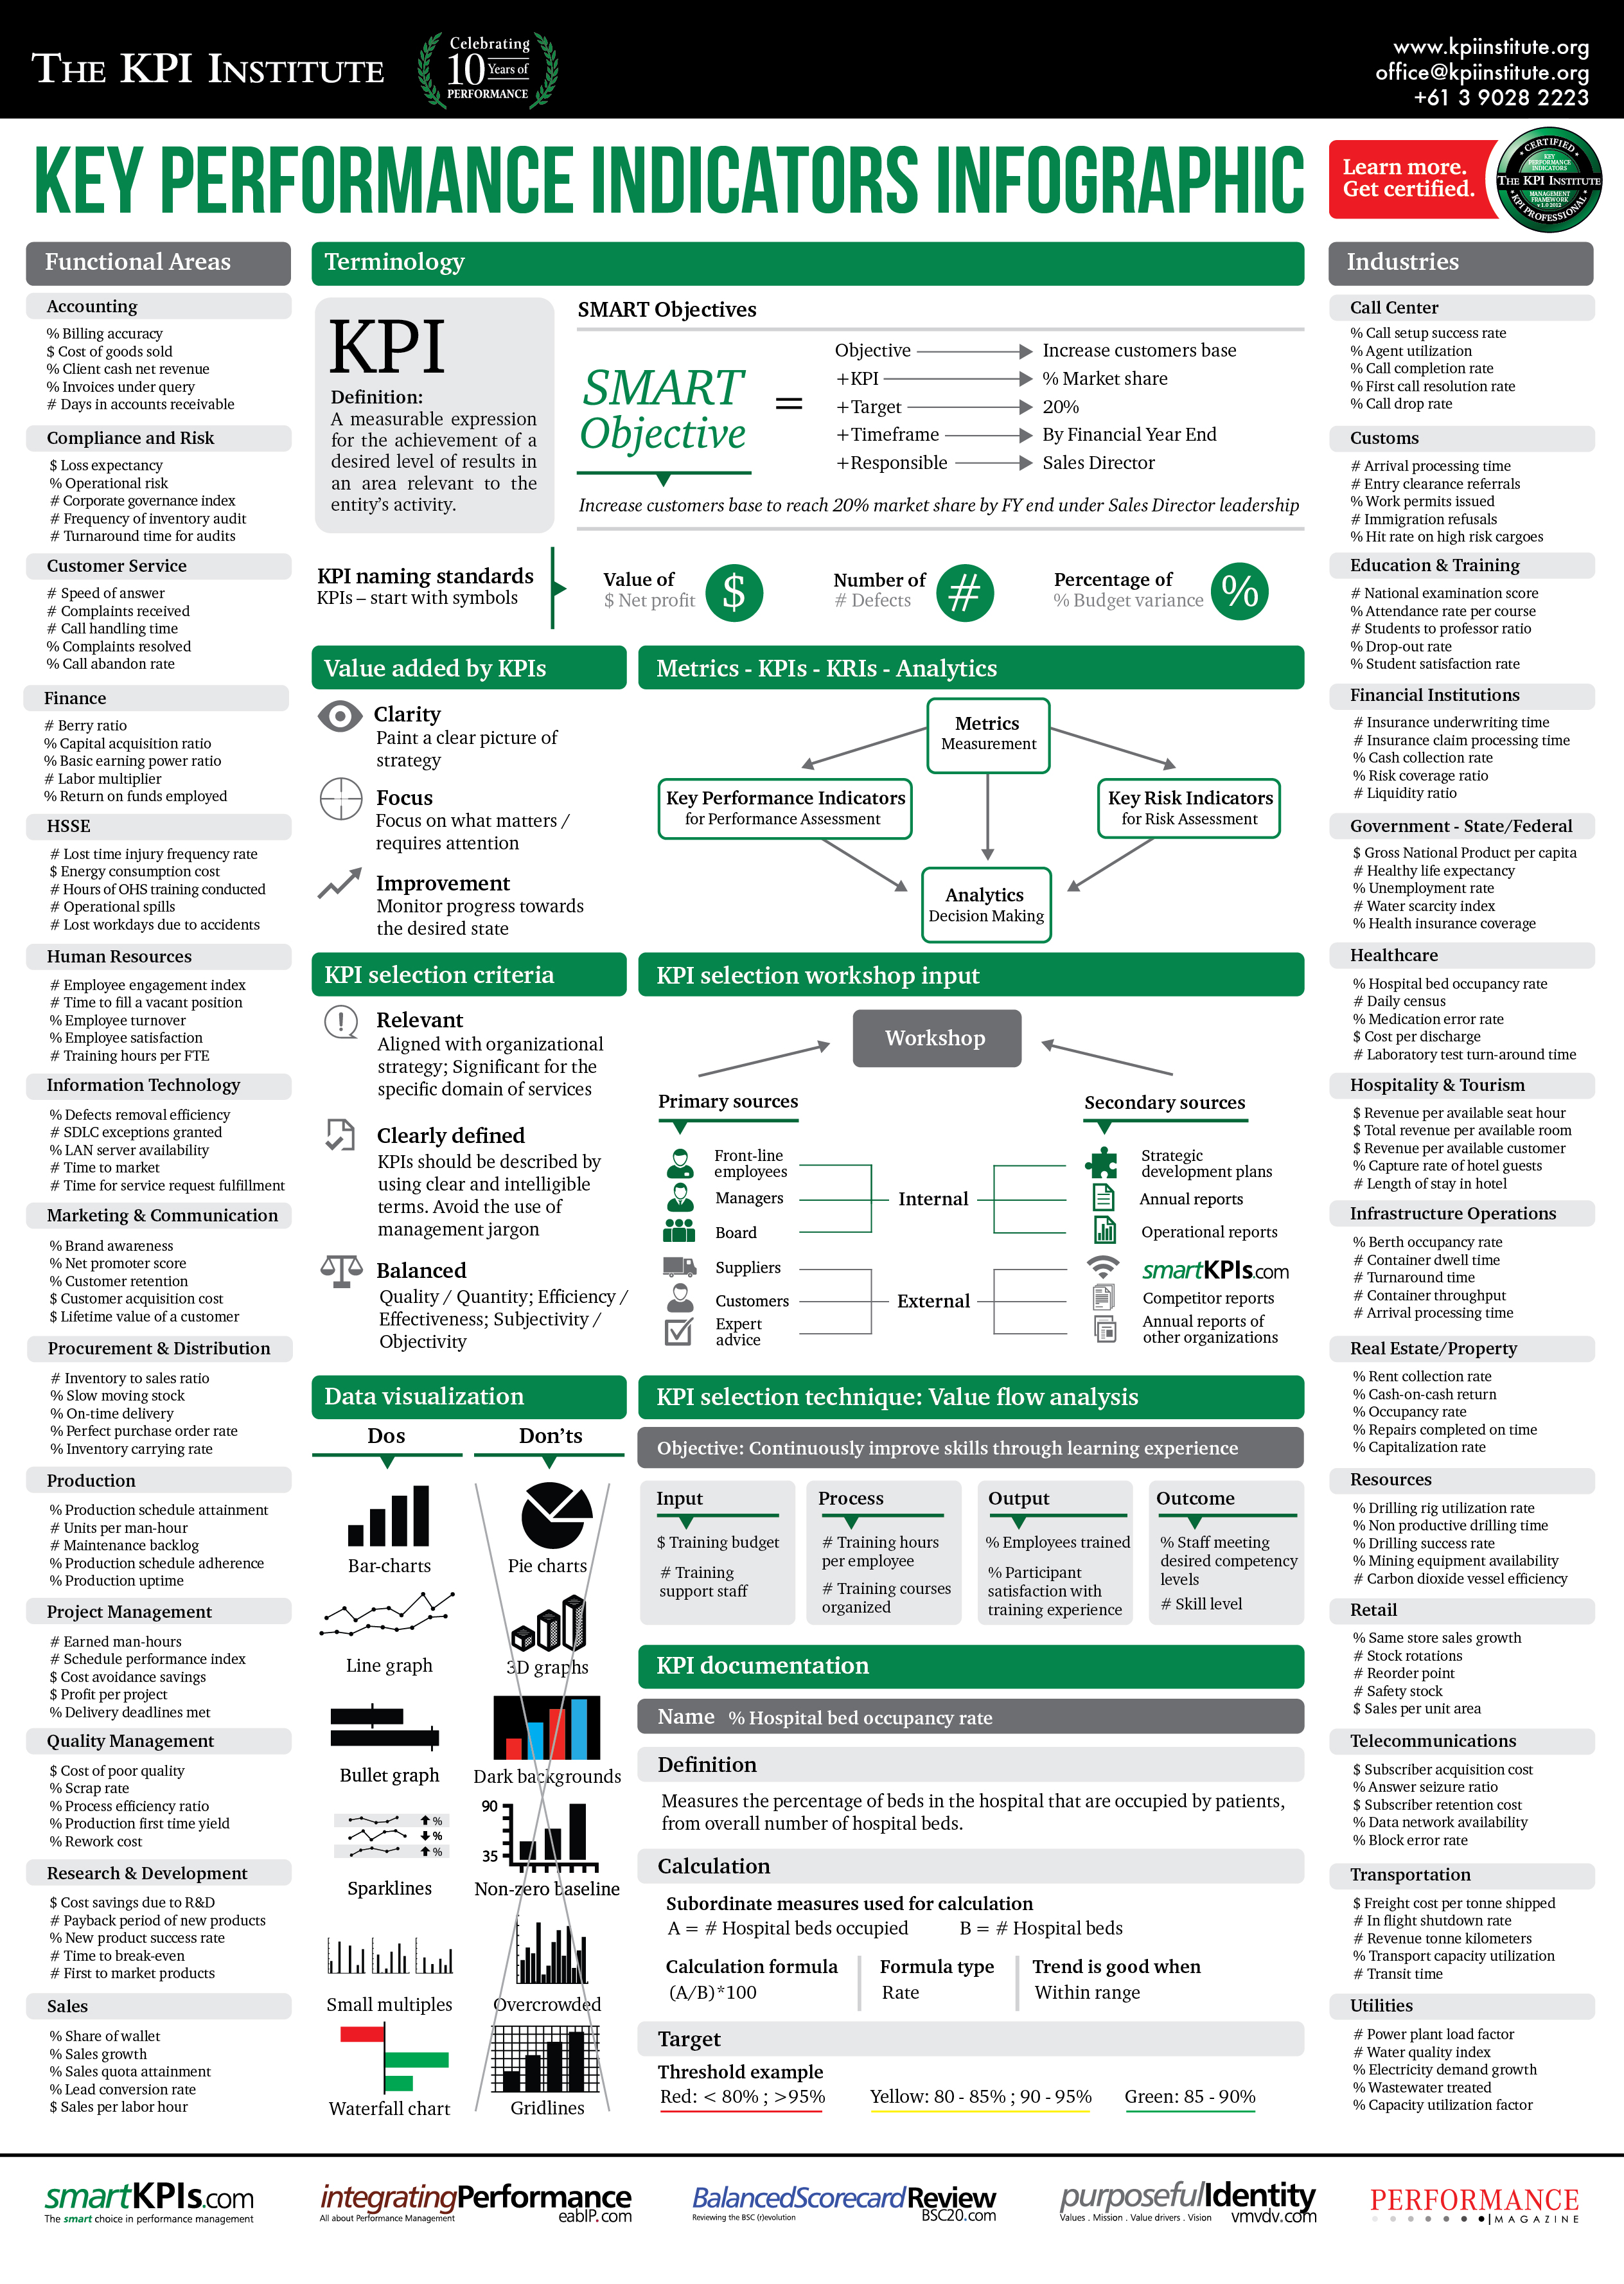
To better comprehend the complexity of using Key Performance Indicators, The KPI Institute developed an infographic that shows in a simple, easy-to-follow way, how to work with Key Performance Indicators.
The KPI Infographic focuses on clarifying the KPI terminology and addresses the most challenging aspects of using KPIs. The most important do’s and don’ts in data visualization, a critical step in properly reporting KPIs, are also provided.
To download the KPI Infographic click here.