Monthly Archives: August, 2024

Who’s building the government of the future? Insights from Performance Magazine’s Government Edition

August 28th, 2024 Posted by Publications 0 thoughts on “Who’s building the government of the future? Insights from Performance Magazine’s Government Edition”

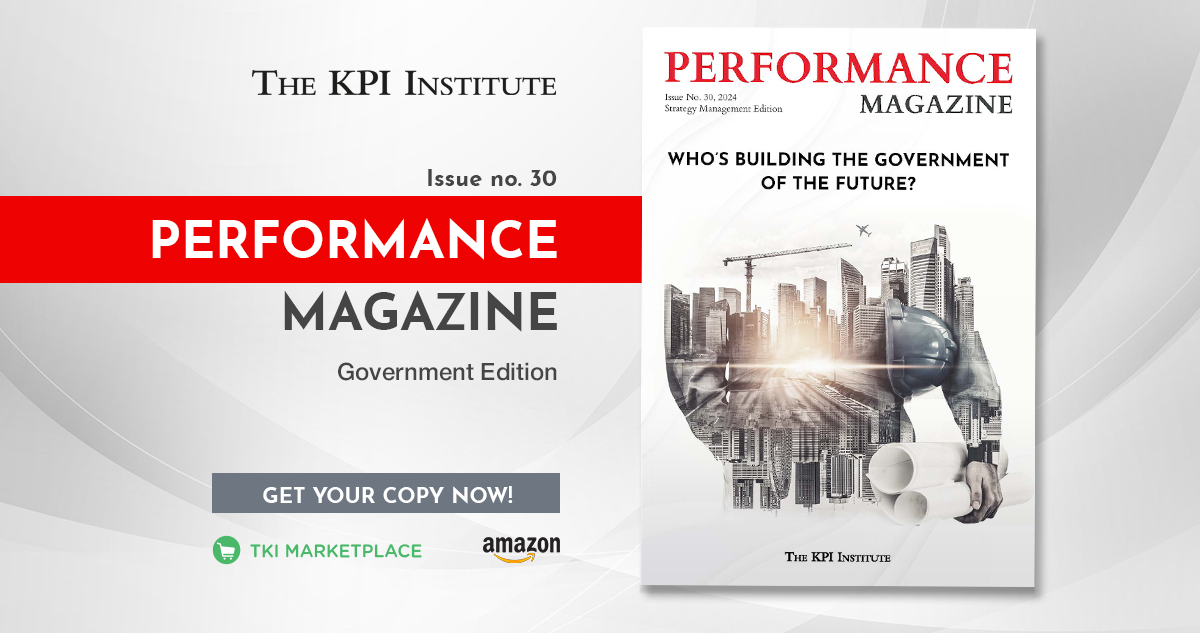
“The pursuit of strategic excellence in performance management continues to be a cornerstone for nations striving to deliver exceptional public services. Certain countries have emerged as frontrunners in this context, setting a high bar for strategic planning and execution,” writes Marcela Presecan, Head of Research at The KPI Institute (TKI), in the cover story of Performance Magazine Issue No. 30, 2024 – Government Edition.

The latest edition of Performance Magazine provides a comprehensive exploration of how such pioneering nations enhance government effectiveness through innovative strategies, effective performance management practices, and adaptability to emerging trends and technologies. The publication’s In-depth pieces highlight governments excelling in those areas and analyze their successful journeys based on  TKI’s Government Services Index 2023

In the magazine’s Interviews section, experts and practitioners offer actionable insights into how government performance is being redefined by forward-thinking approaches in various aspects, such as workforce development, strategy planning and implementation, and the adoption of artificial intelligence.

Moreover, by examining successful case studies and sharing expert opinions, Performance Magazine equips readers with the knowledge needed to navigate the complexities of modern governance, thrive amidst them, and drive impactful change in their organizations.

As nations seek ways to improve public service delivery, this edition of Performance Magazine serves as an essential resource for understanding and implementing the strategies that shape resilience and progress.

Design the future and explore the blueprint for better governance. Grab a copy of Performance Magazine Issue No. 30, 2024—Government Edition. A digital version is available for free download via the TKI Marketplace, or you can order the printed edition on Amazon.

First in the 2024 series: Top 25 Sustainability KPIs is now available

August 21st, 2024 Posted by Publications 0 thoughts on “First in the 2024 series: Top 25 Sustainability KPIs is now available”

In today’s competitive business environment, key performance indicators (KPIs) are crucial for guiding organizations toward their goals. KPIs offer clear and measurable insights into performance and help businesses track progress, identify areas for improvement, and make data-driven decisions. By translating complex data into actionable metrics, companies using KPIs can stay on course and achieve sustained growth. Committed to helping organizations achieve such excellence, The KPI Institute (TKI) is pleased to present its Top 25 Key Performance Indicators (KPIs) – 2024 Edition series.

The Top 25 KPIs Reports are designed to share TKI’s expertise on utilizing KPIs for performance measurement. These reports aim to familiarize readers with the most relevant KPIs in their industry or functional area. Additionally, the reports offer a practical, step-by-step guide for improving performance, which highlights how KPIs can bring greater clarity, focus, and enhancement to any performance measurement process.

The 2024 edition of the Top 25 KPIs reports features a two-page KPI Documentation Form Template. The first page includes updated fields based on the latest research and analysis from TKI, and the second page provides essential guidance on KPI reporting. It features practical examples of KPI results and illustrative designs for scorecards and dashboards for each KPI featured in the report.

First in the 2024 series, the “Top 25 Sustainability KPIs – 2024 Edition” provides a meticulously curated list of the most relevant and influential KPIs that can help organizations track their sustainability performance. These KPIs are selected based on extensive real-world data, ensuring they reflect the most pressing and actionable areas relevant to sustainability.

The report gathered the 25 most commonly used KPIs for measuring sustainability efforts from 2023 to 2024. The methodology involved ranking KPI examples listed on smartKPIs.com based on their popularity during the specified period.

To uncover the top 25 sustainability KPIs, download the digital copy today via the TKI Marketplace or order a printed copy from Amazon


Quarterly KPI Highlights: optimizing customer engagement, operations, and agile practices

August 14th, 2024 Posted by KPIs 0 thoughts on “Quarterly KPI Highlights: optimizing customer engagement, operations, and agile practices”

Key performance indicators (KPIs) serve as essential navigational tools, guiding organizations toward success in both strategic planning and operational execution. 

According to the State of Strategy Management Practice Global Report – 2023, “KPIs are extensively employed in two main areas: employee performance evaluations and corporate performance assessments.” Using KPIs in employee evaluations establishes clear expectations, tracks progress, and offers feedback. Similarly, KPIs employed in corporate performance assessments track progress toward strategic goals.

The KPI Institute launched a series of free infographics called KPI of the Month to offer insights into the practical application of KPIs. Each infographic focuses on a particular KPI that provides explanations of terminology and addresses key challenges related to its use. The monthly infographics include profile, calculation, balanced scorecard focus, data profile, targets, and practical recommendations.

To ensure that you stay informed and updated, we’ve compiled the KPI of the Month from the second quarter of 2024: $ Customer Lifetime value, # Cycle time in Agile, and % Projects with benefits realized. These KPIs not only highlight essential aspects of customer engagement, operational efficiency, and project management, but also play crucial roles in promoting sustainable growth and enhancing organizational agility. Let’s take a look at each KPI and its function:

KPI of April:  $ Customer Lifetime value – This indicator “measures the monetary value a company anticipates earning from a customer throughout their lifetime as a paying client.” Its purpose is to determine the value of customers based on their unique characteristics. Moreover, utilizing this indicator can assist organizations in refining marketing strategies, improving customer retention, and maximizing long-term profitability. To learn more about the $ Customer Lifetime value, download the poster on TKI Marketplace.

KPI of May:  # Cycle time in Agile – The purpose of this indicator is to assess the effectiveness of the development process of a team. It determines the average amount of time needed to accomplish a task from the time it starts the development process until it is finished and delivered. The # Cycle time in Agile helps find areas where processes can be streamlined by measuring output and delivery speed across several iterations. Download the free digital poster via TKI Marketplace.  

KPI of June: % Projects with benefits realized – This indicator measures the proportion of projects in the portfolio that have achieved or realized the expected benefits in relation to the total number of projects in the portfolio. Projects that use the benefits realization method seek to offer particular outputs in addition to strategic aims. To learn more about practical applications for this indicator, get a free copy of the poster from TKI Marketplace.

To widen your KPI expertise with an extensive collection of documented KPIs across diverse industries and functions, visit smartKPIs.com— a leading online platform dedicated to performance measurement and KPI management. It hosts the world’s largest database of documented KPI examples, offering resources such as KPIs by industry and department, and dashboards. Check it out now!

Certified Data Visualization Professional: unveil the meaning behind numbers

August 7th, 2024 Posted by Certification 0 thoughts on “Certified Data Visualization Professional: unveil the meaning behind numbers”

Is data analytics in your organization struggling to make an impact on decision making and lead the road for better results? You are not alone. Only 26.5% of responding companies in the 2022 Big Data and AI Executive survey reported themselves as having successfully transformed into data-driven organizations. Over 90% of executives saw the greatest barrier against being data-driven is the organization’s culture and employees’ skills.

The set of skills that is crucial for data-driven transformation lies under the umbrella of data literacy, which 82% of managers expect all employees to have, according to another survey by Forrester. Yet, only 40% of employees say they are provided with the data skills they are expected to have.

One of the main ways of cutting through this data literacy gap and initiating its development within an organization is to implement good data visualization practices. To inform, persuade and engage employees and managers at different levels, nothing is better than transforming cold numbers into well-crafted visuals presented in the proper context.

Implementing good data visualization practices is the main goal of the Certified Data Visualization Professional course of The KPI Institute. 

Course overview

This course will improve communication within your company through visual displays. Through practical applications, you will learn how to communicate visually in an effective way and how to increase reporting efficiency, leading to a better understanding of the presented data, and thus, to smarter and quicker strategic decisions.

The course approaches its goal of helping organizations implement optimal data visualization practices through ensuring that participants are able to:

  • Identify data visualization fundamentals and best practices
  • Apply data reporting principles in business settings
  • Generate optimal graphs, data presentations, dashboards and BSCs, using Microsoft Excel, PowerPoint and PowerBI
  • Acquire the ability to critique data visualizations based on well-established concepts and assessments

Benefits and importance

By becoming a Certified Data Visualization Professional, you will gain a wide range of benefits that include:

  • Receiving relevant guidance for developing visual representations in order to discover, understand and communicate information
  • Creating better and more relevant reports by understanding the fundamental concepts in data visualization
  • Offering intelligible data sets to decision-making parties through creating excellent graphical representations
  • Improving your performance in presenting data and enhance viewer experience
  • Gaining access to a wide variety of templates, toolkits and resources developed by The KPI Institute
  • Obtaining 40 CPD credits to include in your CPD records for your professional body, institute, regulator or employer

Course structure and methodology

The course encompasses a three-stage educational process with an expected duration of 40 hours:

  1. Pre-course stage: This stage ensures a seamless transition into the training program. You will evaluate your current skills, join an interactive online forum, and understand the groundwork for a collaborative learning journey.
  2. Core-course stage: Participants can choose between attending live online sessions or engaging in face-to-face interactions. They will engage in experiential learning and a high level of interactivity, complete their Individual Learning Maps, and take the certification exam.
  3. After-course stage: You will be a part of thought-provoking forum discussions and explore additional readings. You will be able to create an actionable plan based on your organization’s needs.

Course syllabus

The core course comprises 11 learning modules:

  1. Data visualization parameters
  2. Data collection and preparation
  3. Visual communication channels
  4. Visualization structure
  5. Visualization format
  6. Visualization expression
  7. Pivot charts in Excel
  8. Data presentations in PowerPoint and Excel
  9. Dashboards in Excel and PowerBI
  10. Scorecards in Excel
  11. Visualization assessment

Flexible learning options

The KPI Institute offers this course in both face-to-face and live training formats, scheduled around the year to accommodate different format and time preferences.

Certification and recognition

Upon completion, participants will receive the following certificates (soft copy):

  • Certificate of Attendance: for course sessions participation
  • Certificate of Completion: after fulfilling pre-course activities and passing the Certification Exam
  • Certified Professional Diploma: upon successfully completing all three stages of the learning experience and once the full payment has been received by the contractor
  • CPD Certificate of Attendance: provided once you achieve Professional Status

Don’t you think it’s time for your organization to leverage its data insights for greater impact? Become a Certified Data Visualization Professional. Enroll today and invite your colleagues!

Recent Comments

    Archives