Have you also felt it? The nagging sense that being busy is not the same as being successful. As we move into 2026, the old metrics of long hours and ceremonial accolades are being replaced by something more meaningful. The search for meaning begins with discovering your priorities, whether for yourself or at work. Reflections and touchstones can guide how those insights take shape.
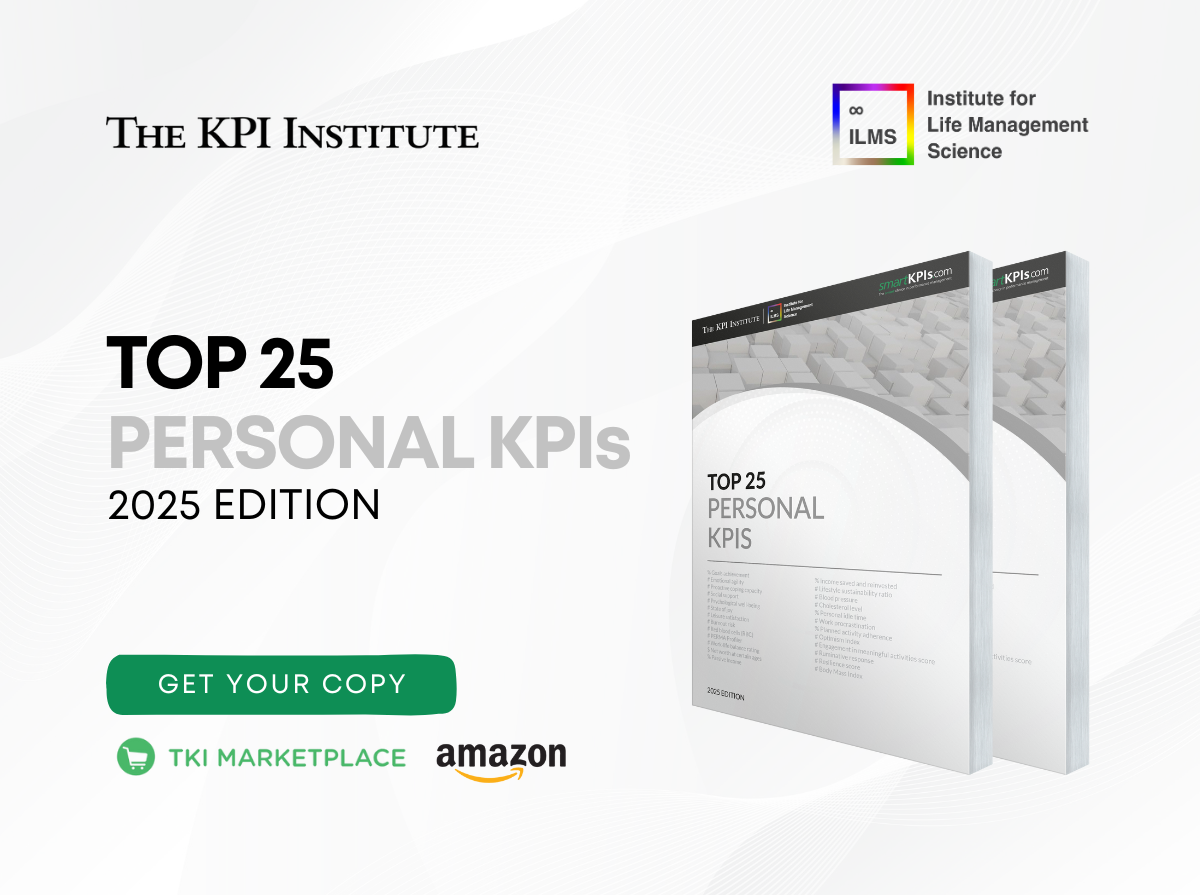
To help organizations and professionals navigate this, The KPI Institute and the Institute for Life Management Science have teamed up to release the Top 25 Personal KPIs – 2025 Edition. It is a research-backed blueprint for self-mastery in 2026. This updated report moves beyond traditional productivity to offer a holistic framework of 25 essential metrics, including enhanced templates and expert insights on AI-native workflows and mental resilience.
At the core of this framework is the concept of personal performance—the progress a person makes toward their own goals. It shows how well someone manages their time, energy, and money to reach the outcomes they want. Unlike organizational performance, which follows standardized goals and external benchmarks, personal performance is shaped by individual values and priorities. It covers different areas of life, including health and well-being, daily productivity and habits, relationships, learning and career development, and financial stability.
Translating progress across these areas requires clear measurement. A key performance indicator (KPI) is a measurable way to track progress toward a personal goal, turning intentions into actionable metrics that support better decisions and continuous growth. Personal KPIs can be monitored using tools ranging from digital apps and habit trackers to spreadsheets, journals, and goal-planning platforms.
To bridge this gap, the 2025 edition highlights 25 critical metrics, organized across six key categories essential for gaining a competitive edge in both life and work:
- Personal Productivity – measures how effectively individuals organize their time, energy, and activities to accomplish both personal and professional objectives. Examples include:
- % Goals achievement
- % Personal idle time
- # Work procrastination.
2. Personal Resilience – evaluates an individual’s ability to manage adversity, adapt to change, and sustain mental and emotional well-being during periods of stress, such as:
- #Emotional agility
- # Proactive coping capacity
- # Social support
3. Well-being – centers on overall physical, mental, and emotional health, incorporating practices that both prevent burnout and support recovery. It includes indicators like:
- # Psychological well-being
- # Burnout risk
- # Work-life balance rating
4. Happiness – reflects perceived life satisfaction, emotional balance, and overall subjective well-being. Examples include:
- # State of joy
- # Leisure satisfaction
- # Optimism index
5. Longevity – tracks lifestyle and health-related behaviors that support a longer, healthier life, including nutrition, sleep quality, and physical activity. Some of the indicators that can be used to track Longevity are:
- # Red blood cells (RBC)
- # Cholesterol level
6. Affluence – assesses financial security and stability through measures such as savings habits, diversified income streams, and long-term investment growth, which can be measured through, but not limited to:
- $ Net worth at certain ages
- % Passive income
- #Lifestyle sustainability ratio
Recognizing these dimensions is only the starting point. The six categories above provide a comprehensive framework, but knowing how to track and apply these metrics is what turns insight into action. By measuring your progress, you gain clarity on what’s working, what needs adjustment, and how to align daily habits with your bigger goals.
By using the Top 25 Personal KPIs – 2025 Edition, you’re not just tracking data—you are understanding your own rhythm. In 2026, the most successful people won’t have the longest to-do lists, but the clearest insight into their progress.
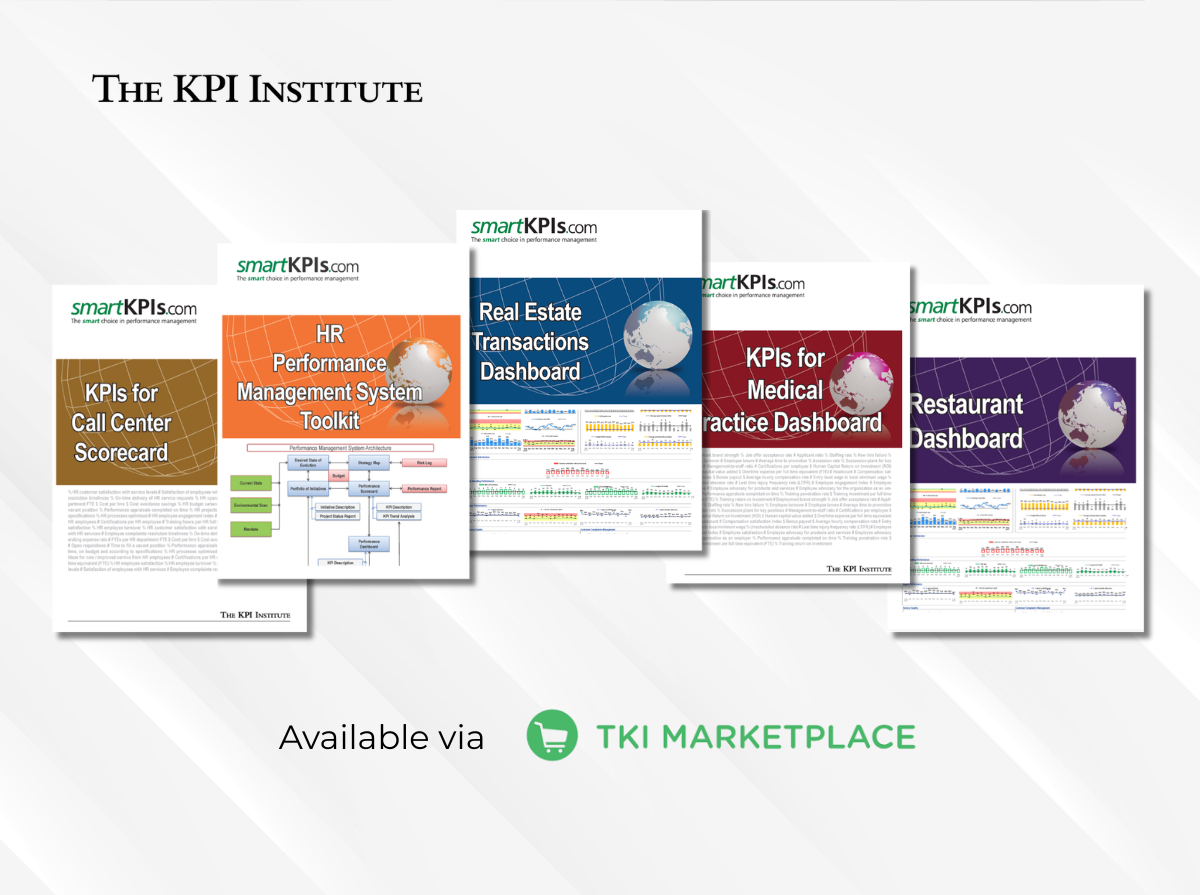
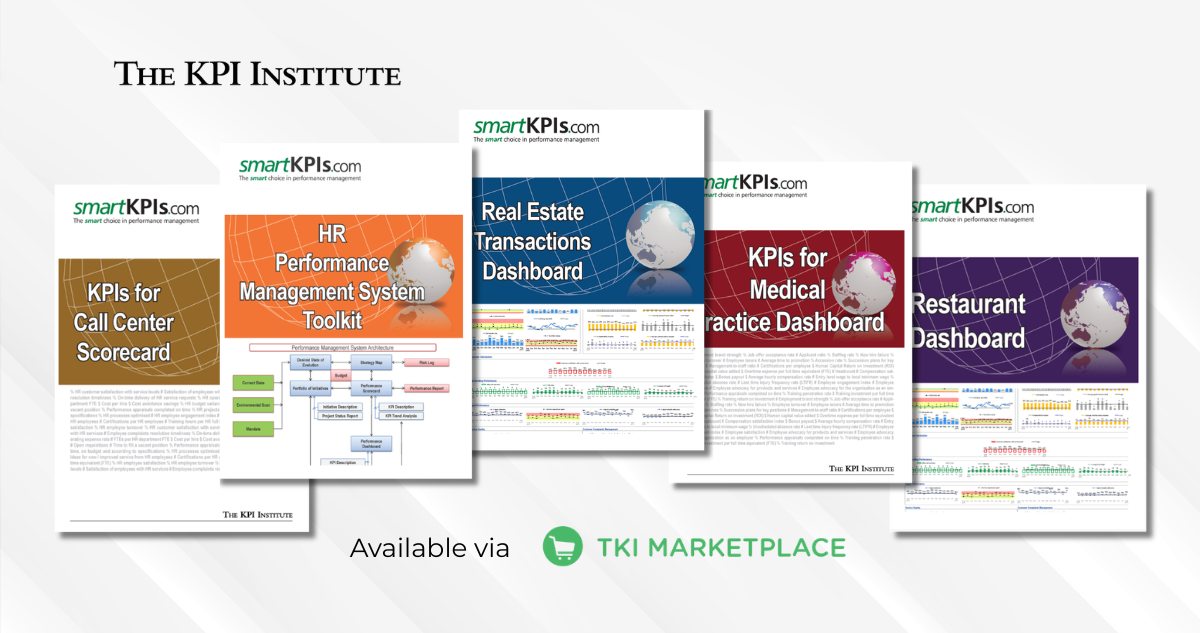
Discover the top five most-used and popular Personal KPIs and learn how to apply all 25 metrics in your life by downloading the Top 25 Personal KPIs – 2025 Edition, available both on the TKI Marketplace and Amazon.