Posts tagged "Data Analysis"

Certified Data Analysis Professional: breaking down barriers in data culture

July 3rd, 2024 Posted by Certification 0 thoughts on “Certified Data Analysis Professional: breaking down barriers in data culture”

According to the 2022 Big Data and AI Survey, 97% of participating organizations invest in data initiatives, yet only 26.5% report that they have created a data-driven organization. The great barrier lies within the difficulty of creating a data culture.

One of the main aspects of building a data culture is to foster data literacy among managers and executives. Such literacy includes the ability to read, work with, analyze and argue with data, understand analytical methods and techniques applied, and describe the use case of application and resulting business value.

Developing such capabilities is what the Certified Data Analysis Professional course of The KPI Institute is all about.

Course overview

The Certified Data Analysis Professional is the first level of the Data Analysis Program. It is a hands-on training course aimed at equipping professionals with the necessary concepts and tools to perform basic statistical and analytical reporting activities and generate value out of existing data. 

The course provides participants with the knowledge required for understanding distinct methods used in analyzing data and statistical interpretation of quantitative and qualitative data and becoming proficient in using key Microsoft Excel features. Participants can expect to reach the following learning objectives:

  • Developing a hands-on, practical overview of data analysis and connected topics;
  • Integrating statistical concepts and analysis tools that are widely used in corporate analytics environments;
  • Analyzing examples of practical applications for statistical methods used in solving real-life business issues;
  • Acquiring mastery of Microsoft Excel Data Analysis features by learning to use statistical techniques through practical examples.

Benefits and importance

By becoming a Certified Data Analysis Professional, you will harness the following benefits:

    • Obtaining the most relevant data, by setting up a customized data analysis process
    • Understanding the data analysis process, its methodology, and logical framework
    • Obtaining the necessary knowledge to analyze complex data and to interpret results
    • Improving the organization’s decision-making process, by gaining knowledge on data analysis and interpretation;
    • Receiving the management team’s buy-in, by sharing with them the utility of implementing a customized data analysis methodology in daily business activities;
  • Obtaining 40 CPD credits to include in your CPD records for your professional body, institute, regulator or employer

Course structure and methodology

The course encompasses a three-stage educational process with an expected duration of 40 hours:

  1. Pre-course stage: This stage ensures a seamless transition into the training program. Participants will assess their current skills, engage with their fellow participants through an interactive online forum, and lay the groundwork for a collaborative learning journey.
  2. Core-course stage: Participants can choose between attending live online sessions or engaging in face-to-face interactions. They will engage in experiential learning and a high level of interactivity, complete their Individual Learning Maps, and undertake the certification exam.
  3. After-course stage: Here, participants will engage in thought-provoking forum discussions and explore additional readings. They will be able to develop an actionable plan tailored to their organization’s needs.

Course syllabus

The core course comprises 14 modules that gradually build on theory towards application and start from basics to advanced.

  1. Business understanding
  2. Data collection
  3. Data preparation
  4. Data Exploration
  5. Descriptive statistics
  6. Sampling
  7. Estimation of population
  8. Hypothesis testing
  9. Z-test and t-test
  10. Analysis of variance
  11. Chi-square tests
  12. Simple linear regression
  13. Multiple linear regression
  14. Time series

Flexible learning options

The Certified Data Analysis Professional course is offered frequently in English and Arabic to accommodate everyone’s schedule and language preferences.

Certification and recognition

Upon completion, participants will receive the following certificates (soft copy):

  • Certificate of Attendance: for course sessions participation
  • Certificate of Completion: after fulfilling pre-course activities and passing the Certification Exam
  • Certified Professional Diploma: upon successfully completing all three stages of the learning experience, as well as the full payment received by the contractor
  • CPD Certificate of Attendance: provided once you achieve Professional Status

It’s time to cut through the data culture gap and transform your organization into a data-driven one. Enroll today and become a Certified Data Analysis Professional

Madhur Mayank Sharma: achieving speed and accuracy in data analysis

September 27th, 2023 Posted by Publications 0 thoughts on “Madhur Mayank Sharma: achieving speed and accuracy in data analysis”

The KPI Institute recently interviewed Madhur Mayank Sharma, senior director and head of AI development at SAP Asia PTE LTD and share insights with PERFORMANCE Magazine about about the challenges and opportunities in adopting artificial intelligence in the Asia Pacific region, and how to develop a data strategy that aligns with business objectives and how to foster data literacy within organizations.

TKI: As the Head of the AI Development team for SAP, how do you define a good data strategy? What does it entail?

Madhur: For companies to drive innovation, improve operational efficiency, and deliver better business outcomes, a sound data strategy is a must. Establishing clear business objectives helps in identifying needed data points and data quality. With this in place, choosing the right data platform facilitates the creation of the required digital infrastructure. This infrastructure should support seamless and real-time data flow from the source of generation to the point of decision-making. Lastly, proper training and continuous process improvement result in positive business outcomes.

TKI: What are the unique opportunities and challenges that come with developing AI products and services in the Asia Pacific region, and how do you ensure that your team is able to effectively address these factors?

Madhur: The Asia Pacific region represents a unique challenge and opportunity when it comes to the adoption of AI products and services. On one side, the ever-changing business landscape, language barriers, and varied business processes pose challenges for AI systems to provide desired results. On the other hand, companies are willing to experiment, are open to changing business processes, and have adopted innovative ways of running the business, helping usher in innovation.

TKI: How do you balance the need for speed and agility in data analysis with the need for accuracy and rigor in data modeling and interpretation?

Madhur: This balance needs to be established on a case-by-case basis. Critical business functions in which decisions may profoundly impact business outcomes require more attention and hence better accuracy and rigor in data modeling. Meanwhile, the faster deployment of data modeling may help enhance the user experience for the business processes where user behavior and action require facilitation and substantiation. Agility and relevance are fundamental to both critical and non-critical business functions.

To read more about the latest trends, strategy, and performance management in data analytics, check out the latest issue of Performance Magazine today! You can get a free digital version via the TKI Marketplace or order a printed copy from Amazon. Please be informed that the price may vary for printed copies depending on your location.

The Key to Developing a Powerful Data Strategy [Excerpt]

September 12th, 2022 Posted by Research 0 thoughts on “The Key to Developing a Powerful Data Strategy [Excerpt]”

Editor’s Note: Below is an excerpt of an article written by Islam Salahuddin, a Business Research Analyst at The KPI Institute. “The Key to Developing a Powerful Data Strategy” is originally published in the 22nd PERFORMANCE Magazine – Printed Edition.

Amidst the buzzing world of data, companies may find themselves directly diving into analytics due to the fear of falling short and missing out. However, many resources can be spent on catching up on the race but end up with no real results.

That happened to 60-85% of big data projects, which IBM reported to have failed because they focused solely on technology. IBM added that the projects did not have a data strategy and a data-centric culture supporting  business objectives. 

Meanwhile, the Massachusetts Institute of Technology’s MIT Technology Review Insights survey of 357 business leaders and decision-makers in July 2021 has revealed that only 20% are implementing a data strategy. While 30% of the respondents have a data strategy in place, they believe it still has gaps.

What Makes Executing a Data Strategy at Scale Difficult

According to 42% of MIT’s respondents, the main challenge for implementing a data strategy is access to “more sources of data, including demographics, competitor, and geospatial information.” Thirty-four percent admit they need help with extracting meaningful insights from their data, while some believe they need “better tools and infrastructure for data storage and analytics.”

In the survey’s report, “in unpredictable times, a data strategy is key ,” says Ishit Vachhrajani, Enterprise Strategist at Amazon Web Services,  emphasizing that all the challenges mentioned by the respondents can be blamed on “cultural obstacles” within their organizations.

“We talk a lot about technology, but one problem we hear from leaders is overly centralized, HIPPO-based decision-making that stands in the way,” Vachhrajani said. He also blames the challenges to governance structures that are no longer effective in bridging people who understand and work with data and frontline employees involved in decision-making and customer interaction.

In the same report, Jonathan Lutz, Director of Technology at Aquiline Capital Partners, describes the implementation of a successful data strategy as an “all-hands effort.” He recommends strong support from the top and buy-in across the organization.

For Vachhrajani, a successful data strategy is driven by leaders who invest in equipping people with the right skills and adopting technology across the company.

To learn more on how to establish an effective data strategy, read the full article in the latest edition of PERFORMANCE Magazine. The 22nd PERFORMANCE Magazine – Printed Edition caters the role that data plays in transforming organizations as they achieve excellence, growth, and success. Grab your copy in the TKI Marketplace now!

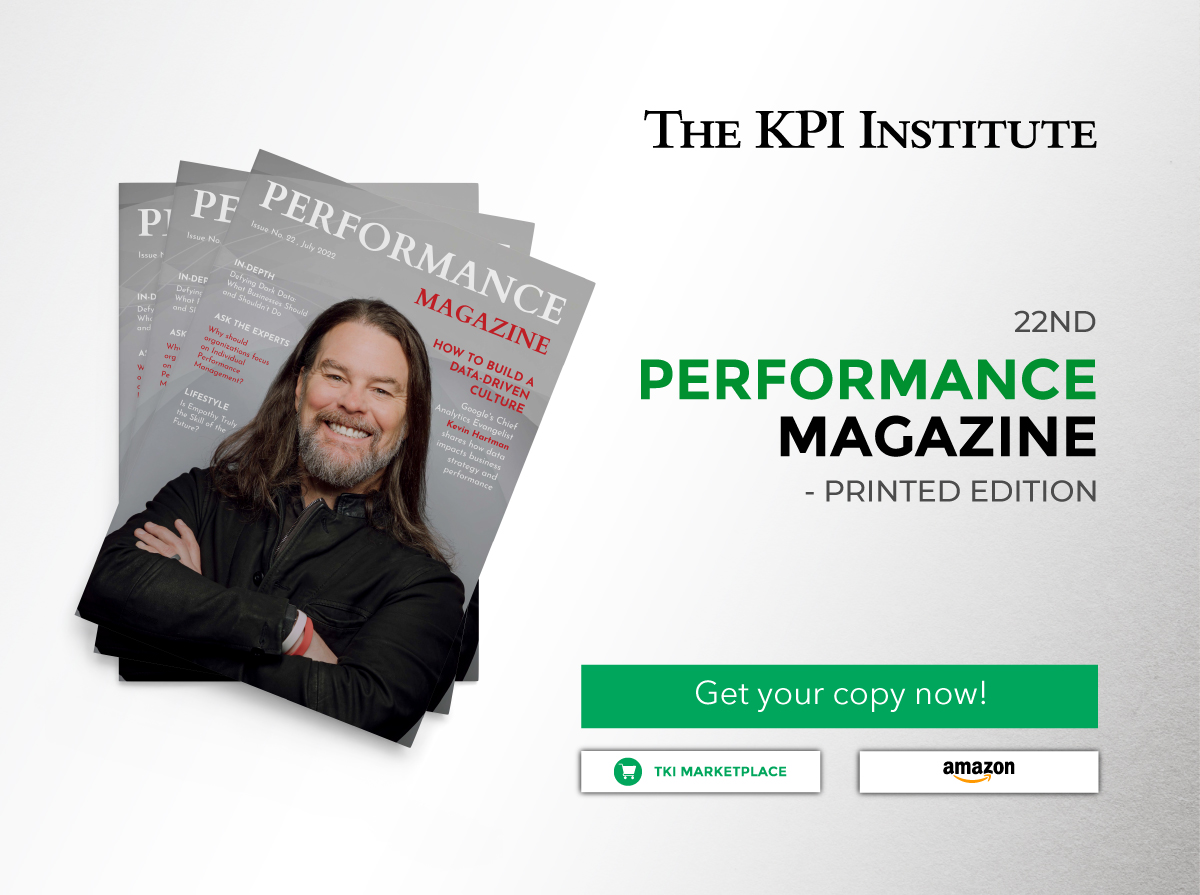
The 22nd Performance Magazine – Printed Edition Is Now Out!

August 31st, 2022 Posted by Press release 0 thoughts on “The 22nd Performance Magazine – Printed Edition Is Now Out!”

The newest edition of the PERFORMANCE MAGAZINE is now available in The KPI Institute’s Marketplace and Amazon.

The 22nd edition of the Performance Magazine focuses on how data may transform businesses while producing significant results considering that in today’s generation, everything is developing fast and drastically, including how plans are established and implemented, as well as how employees carry out their jobs. 

On the cover, join Kevin Hartman, Google’s Chief Analytics Evangelist, and dive into the world of data analytics. Discover how data creates new structures and dynamic bonds while embodying digitalization.

Moreover, this issue explores how artificial intelligence affects performance management, what makes a strong data strategy, and what the top business intelligence trends are like in 2022. It also covers the digital initiatives of several cities across the world using performance assessment methods and strategic development ideas. This edition can be an instrument for learning how to embrace technological change while making achievements in sustainability.

The 22nd Performance Magazine highlights the following:  

  • The state of strategy and performance management in 2022
  • Updates on industry trends, best practices, and innovations
  • Role of data analytics in business strategy and performance
  • Interviews with strategy experts and academicians
  • Comprehensive global analysis and concept presentations
  • Exclusive insights from top consultants
  • Guides in boosting personal performance
  • Recommended resources and tools for data savvy and decision-makers

Learn more about data analytics, innovation, and digitalization in relation to strategy and performance management while reading through each page of the PERFORMANCE MAGAZINE Issue No. 22, July 2022. You can grab a digital copy in The KPI Institute’s Marketplace or through this link: Performance Magazine 22. For an additional printed copy, you can order yours via Amazon


TKI’s Interview with Google’s Chief Analytics Evangelist: Building a Data-driven Culture

June 20th, 2022 Posted by Press release, Research 0 thoughts on “TKI’s Interview with Google’s Chief Analytics Evangelist: Building a Data-driven Culture”

The KPI Institute (TKI) recently caught up with Kevin Hartman, Google’s Chief Analytics Evangelist, to discuss how data is changing the way organizations develop their strategy and improve their performance.

Below is an excerpt of the interview, which will be published in the next issue of Performance Magazine – Print Edition.

TKI: How important is data today to businesses and organizations?

Hartman: It’s really at the center of everything now, and not just [in] business, but also private life and public sector life and everything in between. It’s data [that] should play a role in every decision that an organization is making — to make them more effective, more efficient… Data and [the] collection of data should play a role in any organization’s operations. It is really at the center of everything that companies are doing today, at least those that are successful.

TKI: What do you think are the challenges that organizations are facing in terms of using data or maybe attempting to use data?

Hartman: Ohh, there are many. You know, from organizations who just don’t have the digital and data maturity — meaning they lack the people, the processes, the technologies to really collect and utilize data. We see that as an enormous challenge. [There are] organizations [that] just haven’t made the investment necessary either because they don’t believe in the return. They don’t want to spend the resources, whatever that is.

But that presents an enormous challenge. Another is just the idea of organizations lacking the kind of leadership that is required to get that organization invested in data and its use, and moving the organization behind a mindset that says data is going to be important to us and we’re going to use data to drive decisions.

…I’d like to say measurement — today getting that right is a leadership challenge, not a technological one. The technology is there. [What matters is] how the organization [will] embrace that challenge and lead from a position of data being a strength.

TKI: Are there times when you’re able to apply what you do at work to your personal life? For example, are there practices at work that you think that people who are not really in the data world professionally can actually adopt at home or for their day-to-day activities?

Hartman: Well, data is a part of everyone’s life… You don’t have to be the chief analytics evangelist at Google for data to affect you. And so I think there’s a lot of crossover, particularly because people are awakening to the existence of data that they are generating online that others are holding and using. And so I think that there’s great opportunity for consumers to just become more savvy in how that data is used, who’s using it, and why.

And it’s no longer a secret should not be because of regulation. And so it — in that way — can become a bigger part of consumers’ lives.

For me personally, I’m in it all the time. I’m either in my work. In the environment and role. Or I teach at a number of institutions and programs, analytics, and so I am fully immersed in this idea of data and the data field all the time.

And it’s really the ability that I have or the opportunity that I have to be that practitioner and see what’s happening in the public sector and private sector, and then stand in front of a classroom of students with the expectation they have that I can explain that to them and make it accessible is really challenging and it keeps me kind of using both of those roles to strengthen how I perform in each area, right? Like my practitioner role at Google makes me a better teacher. My teaching role makes me a better practitioner at Google. So it’s a very symbiotic relationship for me.

*****

To dive deeper into our conversation with Hartman, stay tuned for the release of Performance Magazine – Print Edition No. July 2022. Get updates from the LinkedIn page of The KPI Institute.

How Data Analysis Leads to Smarter Business Decisions According to Practitioners

March 25th, 2022 Posted by Certification, Courses, E-learning, Webinar 0 thoughts on “How Data Analysis Leads to Smarter Business Decisions According to Practitioners”

Big data now plays a crucial role in every business’ success. Through the application of analytics, data analysis is allowing businesses to become even more competitive. 

Organizations adopt big data and analytics to analyze massive volumes of data generated by offline and online trading. Based on the Big Data & Business Analytics Market Statistics 2030, the value of the global big data and business analytics market is estimated to increase to $684.12 billion by 2030 from $198.08 billion in 2020. 

The goal of data analysis is to extract meaningful information and use it to make informed business decisions. By analyzing and comparing previous and new data, organizations can understand what happened in between. Then, organizations can come up with metrics and action plans to drive their performance. It involves boosting customer loyalty, increasing sales, improving and retaining successful practices, and enhancing employee productivity.

According to a PwC poll of 1,000 corporate executives, data-driven firms were three times more likely to achieve big gains in their decision-making capabilities. 

A data-first approach is required for a digital-first enterprise strategy. In a multi-cloud context, a well-planned data strategy for a digital company gives “business transformation opportunities, cost reduction, better engagement, and maximum flexibility.”

To get the most out of data, organizations must create an effective data analysis process. This procedure entails objective setting, data collection, cleaning and analyzing data, and data visualization.

Before collecting data, defining the goals of the organization is important. Businesses can choose the type of data to collect and evaluate it to ensure it is aligned with their goals. Then, businesses must integrate data using tools such as Informatica PowerCenter, SQL Server Integration Services (SSIS) by Microsoft, AWS Glue by Amazon Web Services (AWS), and Alteryx Designer.. 

All data must be gathered in one place to be examined. Companies must clean their data by removing irrelevant and unwanted information, fixing structural errors, and filling out the missing data in order to produce accurate findings. To better understand the data, organizations should use data analysis software and other technologies. 

Some data analysis software available are XLSTAT, the leading data analysis and statistical solution for Microsoft Excel; Python, a powerful tool consisting of materials for any aspect of scientific computing; and SAS, a statistical software for business intelligence and data management.

To acquire useful insights, businesses should dive deep into the data. They should analyze and narrow down the results of the gathered data to draw conclusions. Then, organizations must interpret the results to figure out the best next steps to reach the goals established in the beginning of the process.

Organizations should deliver information in a readable and understandable format. Businesses can present data using graphs, maps, and charts. Data visualization can help companies compare data sets and observe their relationships.

Data analysis helps anticipate future trends more precisely, allowing organizations to determine where they are headed and what they need to get there.

To learn more about data analysis, explore The KPI Institute’s reports and free webinars and stay tuned for the next schedule of the Certified Data Analysis Live Online Course.

5

5 more weeks to register for The KPI Institute’s Live Online 2020 Courses

November 18th, 2020 Posted by E-learning 0 thoughts on “5 more weeks to register for The KPI Institute’s Live Online 2020 Courses”

2020 is slowly, but surely, coming to a close. We are already halfway through November, with December creeping up on us. We can almost hear a distant, faint Mariah Carey, singing ”All I want for Christmas is You”.the kpi institute live online courses

We have had an extraordinary year, completely revamping our certifications and moving them into the online environment. What followed was simply astounding.

Our attendance numbers went through the roof. We began delivering around 6-10 courses a week, instead of our regular 3-4, and participants flooded our events, which was direct feedback that our mission was a success.

Whilst there are still a few weeks left in 2020 – 5 to be specific, we will continue to deliver the same level of quality content in all of our certifications, so if you have not had the chance to sign up for any of the courses, we highly recommend you give them a look-see HERE.

Up until the 14th of December, we’ll still be going strong with numerous events, focusing on a wide variety of topics, from KPIs, OKRs, performance management, and supplier performance, to strategy and business planning, innovation performance, data analysis, and employee performance management.

Keep a lookout on our social media channels – Facebook, LinkedIn, and Twitter, to always be updated on which courses are next, and how can you sign up for them, in the remaining 5 weeks.

Whilst 2020 has been a challenging year, we know we can finish strong, and look forward to a much brighter and better 2021.

online

Multiple TKI Live Online certification courses now available in Arabic

July 23rd, 2020 Posted by E-learning 0 thoughts on “Multiple TKI Live Online certification courses now available in Arabic”

Excellence is a product of knowledge that has been molded and adapted as each situation saw fit. We at The KPI Institute pride ourselves on delivering excellence with each of our courses. online

Since our transition into the online environment, we have seen growing interest in our Arabic-delivered courses. We used to only feature one of our courses in Arabic, namely the Certified KPI Professional course, but now we have decided to increase the roster of certification opportunities available in Arabic.

As a result, all of the following live online courses now feature a standalone version, in Arabic:

  • Certified Strategy and Business Planning Professional
  • Certified Balanced Scorecard Management System Professional
  • Certified Performance Management Professional
  • Certified Data Analysis Professional
  • Certified Data Visualization Professional
  • Certified KPI Professional

You can become a certified Performance Management practitioner, from the comfort of your home. Excellence and improvement know no boundaries, no restraints and no barriers.

In the pursuit of greatness, we have to overcome all of the challenges laid before us. We have decided to meet our attendees half-way and provide a customized, tailored learning experience, which answers their needs to a tee. Meet attractive and sexy yerevan escort girls who can make your stay in the city unforgettably perfect.

If you are located in the Arab world, and wish to add your name to the ranks of all those holding a worldwide recognized certification from The KPI Institute, consider joining any of our live online courses. Excellence is just a click away!

data analysis

TKI is launching the new & improved Certified Data Analysis course

July 21st, 2020 Posted by E-learning 0 thoughts on “TKI is launching the new & improved Certified Data Analysis course”

Since working from home has become the norm around the world, we believe it is a prime time to delve deeper into acquiring new professional knowledge. Learning new skills may come in handy once we reach the time of the great workplace journey, where we’ve all ventured before, but had to put on pause for a while.data analysis

With more and more individuals forming a demand for online training, we thought it would be best if we shifted our efforts towards this new endeavour. As a result, an increasing number of our world class professionalization courses can be found online. One such learning opportunity is our newly launched Live Online Certified Data Analysis (CDA) Professional course.

It provides you with the knowledge required for understanding distinct methods used in analyzing data, statistical interpretation of quantitative and qualitative data, and becoming proficient in using key Microsoft Excel features. The course manages to accomplish this by teaching you how to build frequency and conditional tables, create different types of charts, find correlations and relationships between variables, test hypothesis and engage in statistical modeling.

“The course was very comprehensive, systematic and featured a step-by-step detailing. The materials were structured and arranged in an organized flow, to enable a better learning process.” – Yuvarajah S.Thiagarajah, Specific Resources Sdn Bhd, Kuala Lumpur

For only $1,250, our Live Online CDA course provides you with 15 modules, 3 hours worth of video presentations and 13 hours of practical assignments. At the end of it all, you will undergo a 2 hour evaluation session, which will test all of your newly-acquired knowledge.

What are the benefits?

  • You learn how to set up a customized data analysis process and aggregate only the most important data
  • You learn how to approach the data analysis process, how to apply the correct methodology and make use of a logical framework
  • You learn how to analyze complex data, interpret results and improve your organization’s overall decision-making process
  • You learn how to share the utility of your data with your team, thus receiving the buy-in of both managers and fellow co-workers.

This course is designed for anyone who has basic mathematical training and basic competences in using Microsoft Excel, from managers, HR representatives and analysts, to auditors, acquisition specialists and logistics experts.

Statistical knowledge, intermediate or advanced knowledge of Excel, practical experience with data analysis and related duties are not necessary.

If you have ever pursued a career in data analysis, modelling or any other adjoining activities – campaign management, data mining, statistics, risk management, reporting, data processing for survey analysis, consider this course open for you as well.

What will you learn during this live online certification?

The first 5 modules mainly deal with going over the basics of data collection, data aggregation, data cleaning and understanding the various types of charts (quantitative, qualitative, structural) and analyses (univariate, bivariate) that you will employ, by the end of the course.

The following 5 modules address sampling techniques and all of the information that come with sampling, from distribution & sample sizes, to interval estimations. In addition to this, it will go over hypothesis testing and several types of tests that pertain to this, such as the Z-Test, ANOVA Test, one sample hypothesis test or the paired samples hypothesis test, among others.

The last 5 modules cover the more in-depth operations of data analysis, from chi-square tests, linear regression models, homogeneity tests, coefficient of determination and correlation, to multiple regression, multicollinearity and trend analysis.

Who will be your trainer?

Ágnes Ilyés, Subject Matter Expert at The KPI Institute, holds valuable experience in data analysis, as during both her university and working years she had participated in numerous marketing related research projects where survey based primary researches were conducted and a lot of data were evaluated.

She mainly uses SPSS statistical program to analyze data. She has experience with the following analyses: Chi2 analysis, Variance analysis, Correlation analysis, t-test, factor- and cluster analysis.

Ágnes also deepened her knowledge by teaching inferential statistics as an external lecturer on the university, on economics and business administration faculty, marketing specialization.

As a Business Research Analyst at the KPI Institute she also has numerous possibilities to capitalize her experience in this field.

Final thoughts

The Data Analysis Professional is the first level of our Data Analysis Program. It is a hands-on training course aimed at equipping you with the necessary concepts and tools needed to perform basic statistical and analytical reporting activities, in order to generate value out of the existing data.

In a world of unknowns, data is more important than ever. Understanding what to make of it, and how to separate the wheat from the chaff goes a long way in providing accurate, clear answers. Our Live Online Certified Data Analysis course can help you achieve that objective.

analysis professional

Certified Data Analysis Professional – 13 – 17 July

June 29th, 2020 Posted by E-learning 0 thoughts on “Certified Data Analysis Professional – 13 – 17 July”

The Certified Data Analysis Professional is the first level of our Data Analysis Program. It is a hands-on training course, aimed at equipping you with the necessary concepts and tools needed to perform basic statistical and analytical reporting activities, in order to generate value out of the existing data.analysis professional

The course provides you with the knowledge required to understand distinct methods used in data analysis, statistical interpretation of quantitative & qualitative data, and becoming proficient in using key Microsoft Excel features.

It achieves this by teaching you how to build frequency and conditional tables, create different types of charts, find correlations and relationships between variables, test hypotheses, and engage in statistical modeling.

This 40-hour learning experience lasts for a total of 5 days, ending in a 1-hour examination session.

What will you learn

  • Develop a hands-on, practical overview of data analysis and connected topics;
  • Integrate statistical concepts and analysis tools that are widely used in corporate analytics environments;
  • Analyze examples of practical applications for statistical methods, used in solving real-life business issues;
  • Acquire mastery of Microsoft Excel Data Analysis features, by learning how to use statistical techniques through practical examples.

What’s in it for you – Benefits

  • Obtain the most relevant data, by setting up a customized data analysis process;
  • Understand the data analysis process, its methodology, and logical framework;
  • Obtain the necessary knowledge to analyze complex data and interpret results;
  • Improve the organization’s decision-making process, by gaining knowledge on data analysis and interpretation;
  • Receive the management team’s buy-in, by sharing with them the utility of implementing a customized data analysis methodology in daily business activities.

Presenter profile

Fadi Fuad Al-Jafari is a Management Consultant at The KPI Institute, specialized in Data Analysis and Visualization.

Fadi has a Bachelor’s Degree in Communication Engineering from Al-Balqa Applied University in Jordan, and a Master’s Degree in Business Administration from the German Jordanian University in Jordan.

Fadi is a Certified Project Manager Professional, has several certifications in Statistics Foundation, Data Analysis using Excel, Analyzing and Visualizing Data with Excel, Working with Real-Time Data in Excel, Excel Macros in Depth, Predictive Analytics using BigML, Train the Trainers, and has been part of several Data Analysis-related projects in the last years.

He has worked on a wide array of projects, such as Network Statistics Reporting Tool, Network Operation Center Balanced Scorecard, Business Specification Documents for Network Operations Center, Zain’s Procedures Alignment with APQC’s PCF, Robotic Process Automation for Network Operation.

Recent Comments

    Archives