Posts tagged "KPIs"

Innovation Highlights: Advancing Performance with State-of-the-Art Solutions

June 13th, 2022 Posted by Certification, Courses 0 thoughts on “Innovation Highlights: Advancing Performance with State-of-the-Art Solutions”

Editor’s Note: “Innovation Highlights: Advancing Performance with State-of-the-Art Solutions” is an article written by The KPI Institute’s Jr. Management Consultant Andreana Dumitrescu and former Business Research Analyst Agnes Ilyes. This piece was first published in the latest edition of Performance Magazine

Embracing innovation is part of upgrading your organization’s performance. It requires building your innovation capability, culture, and management as well as getting inspiration from your environment. Here are some ideas to get you started.

Become a Citizen-Developer

Low-code development platforms have a revolutionary role, increasing the performance of software developers, accelerating application delivery, and simplifying complex tasks. At the same time, low-code and no-code tools for programming allow anyone without experience in the domain to create applications or systems, and these users are called citizen-developers. 

Low-code development platforms can automate time-consuming processes, allow employees to use visual and templated workflows, and make technology products reach the market faster. This leads to efficiency, new levels of growth, and great business value. However, those who need customized solutions may still need to use high-code platforms. While users may no longer need to learn coding, no-code platforms are expensive and may not appeal to small businesses. 

Using Drones in Performance Management

In the construction industry, drones are used to monitor employee productivity, collecting real-time data for organizations and giving them a competitive edge. The system gives them the ability to monitor people and activities and gather information fast. This information can be about whether a project is completed on time and on budget, spotting unauthorized use of or damage to the employer’s property, employee safety, human error, and labor costs. Drones can record photos and videos, and the footage can be easily shared with any device. With real-time access to the progress of a project, managers can determine potential causes of delays and the contribution of employees to the overall business strategy and project success. 

Microlearning as the Future of Workplace Learning

The global microlearning market is expected to reach $3. 8 billion by 2027, according to the report “Global Microlearning Industry” by Reportlinker.com. Microlearning refers to learning delivered in short-form, independent units and typically features personalized videos, tutorials, quizzes, or games. 

The topics of microlearning are the simplified versions of those taught in complex and widely structured learning environments. The shift to remote work and the demand for new skills accelerated the popularity of microlearning. The benefits of microlearning include accessibility, flexibility, and reduced development costs. It attracts workers, especially millennials, who prefer faster and engaging learning sessions, customized, and relaxed to avoid cognitive overload. 

Uber’s T3 B3 Process

When Uber’s employees complained that the company’s traditional performance review was subjective and dwelled too much on employees’ past behavior, the transport company devised a strategy called the T3 B3 Process. T3 B3, which means “top three bottom three,” asks employees to identify their top three qualities and bottom three areas for improvement. Their answers will generate new goals, which are entered into a system accessible to all members of the organization. 

Uber’s new review process highlights development based on job performance. The regular feedback that employees receive are categorized into positive reinforcement or constructive advice. Every week, managers monitor their feedback ratios and balance the two categories.

The Military Adopts the 360-degree Appraisal System to Get Rid of Toxic Leaders

Used by companies like Amazon, IBM, and Netflix, the 360-degree appraisal system will now be integrated into the selection board and assignments processes of the U.S. Marine Corps. It will conduct a pilot program first in 2022 and implement it fully in 2024. This means moving away from solely depending on their fitness reports, which are performance notes from two supervisors. 

The U.S. Marine Corps believes that a 360-degree performance review will help them avoid promoting senior leaders who may not be fit for the positions. By getting the feedback of Marine’s senior officials and subordinates, the organization can detect traits of toxic leadership as well as potential strengths and unidentified weaknesses. 

The 360-degree feedback offers employees regular confidential feedback from multiple viewpoints. This feedback system involves personalized questions and workflows, qualitative feedback, and agile pulse surveys. Moreover, the 360-degree review process emphasizes social reinforcement, encouraging workers to be more open to feedback and adjust their behavior. 

According to Harvard Business Review, initiatives to innovate usually fail and even successful innovators struggle to maintain their performance due to “the lack of an innovation strategy.”

For more than 10 years, The KPI Institute has established standard in every facet of performance management through tailored KPI-based solutions. Join the Certified Innovation Performance Professional Live Online course on 18-22 July 2022 to learn how to link innovation to your organization’s strategy and goals in achieving excellence in performance, or get certified in IP Professional. For further details, visit our website

Can Your Favorite Restaurants Recover From the Pandemic? See New Reports

January 22nd, 2022 Posted by KPIs, Research 0 thoughts on “Can Your Favorite Restaurants Recover From the Pandemic? See New Reports”

Online ordering, digital payments, the rising demand for plant-based items and sustainable packaging, and preference for alcohol-to-go and outdoor dining are just some of the trends that restaurants are adjusting to. 

While consumer behavior and dining preferences have changed due to the COVID-19 pandemic, the restaurant industry sees a glimmer of hope. Sales are expected to increase from $864 billion in 2019 to $898 billions this year, according to the National Restaurant Association’s 2022 State of the Restaurant Industry Report. Meanwhile, the foodservice industry is predicted to generate 400,000 jobs, for total industry employment of 14.9M before the year ends.

However, Hudson Riehle, senior vice president of the Research and Knowledge Group at the National Restaurant Association, emphasized that the restaurant industry may never completely return to its pre-pandemic state. 

Over half of restaurant operators believe that the return to normalcy would take a year or more. Restaurants are still grappling with employee retention and recruitment, food, labor, and occupancy costs, and supply delays or shortages of key food or beverage products.

“We still have work to do to ensure that those operators struggling the most can survive.  The Association will continue to champion the necessary government support needed at the federal and local levels to help keep these businesses — cornerstones of our communities — on a path to better days,” said Marvin Irby, Interim President & CEO of the National Restaurant Association.

What Can Restaurants Do

Use data to adapt to changes. The NPD Group recommends studying restaurant visits each daypart–morning meal, lunch, dinner, and P.M. Snack–and adjusting operations according to the behavior and motivations of diners. “The ability for restaurants, particularly full-service restaurants, to operate at total capacity, consumer comfort with dining in, and more business and recreational travel will aid recovery at the dinner daypart,” NPD states.

Exceed expectations to retain customers. Heleri Rande, a partner at Think Hospitality, a Florida-based real estate development and hospitality company, believes that restaurants should go beyond their usual services. They can add special touches like recipe boxes and contactless drop-off. She also suggests upselling “sides, bottles of wine, and desserts” and encouraging customers to buy gift vouchers. 

Track performance using KPIs. During uncertain times, every business decision is critical. Understanding where a restaurant has potential or needs improvement can help owners develop and implement a customer-focused strategy. This is only possible when they have the data to support their decisions.

The KPI Institute released The Top 25 Restaurant KPIs – 2020 Extended Edition, which compiles the most popular 25 KPIs used by food and beverage units worldwide throughout 2016 and 2020. The 25 restaurant KPIs identified are categorized into six divisions:

  • Restaurant Financials – Incorporate the sales generated by the business from different perspectives and the investments made for its functionality
  • Service Quality – Refers to issues that influence customer’s satisfaction, such as unavailability of menu items or service diversity
  • Customer Feedback – Offers information regarding the customers’ assessment of the restaurant as an indicator of their satisfaction and loyalty
  • Restaurant Occupancy – Represents the attraction of customers and the capacity at which the restaurant operates
  • Restaurant Workload – Reflects on the intensity of the restaurant’s activity and the impact of peak periods on employees
  • Restaurant Governance – Indicates the principles and practices that guide the decisions of the restaurant’s management

Discover the 25 most popular restaurant KPIs today and read each of their profiles, all packed with exclusive in-practice recommendations. Download The Top 25 Restaurant KPIs – 2020 Extended Edition now!

Top 25 Finance KPIs: From Profitability to Portfolio Management

December 16th, 2021 Posted by Research 0 thoughts on “Top 25 Finance KPIs: From Profitability to Portfolio Management”

Finance KPIs help companies monitor their progress, determine where there are more financial benefits, identify areas in the organization that need more attention, and establish growth targets.

The KPI Institute’s The Top 25 Finance KPIs report unveils the most popular 25 KPIs used by global finance divisions throughout 2012 and 2020. Here is an excerpt from the report:

A strategically focused organization ensures that financial indicators track not only performance, but they also reveal trends, raise awareness to risk, and highlight business opportunities. Most of traditional financial metrics such as $ Earnings before interest and taxes (EBIDT), % Return on equity (ROE) and % Net profit margin are lagging KPIs and provide little leverage for a proactive management.

… The methodology used to advance this report consisted of ranking the KPI examples documented and published on smartKPIs.com, based on the number of views acquired in the period mentioned. The hundreds of thousands of visits to smartKPIs.com and the thousands
of KPIs visited, bookmarked and rated by members of the online community provided a rich data set, which combined with further analysis from The KPI Institute’s editorial team, formed a basis for the hereby presented research reports.

One of the most important benefits that this report brings is an international perspective on the most popular finance KPIs. They provide quantifiable measurement of the main components that lead to a successful finance strategy implementation. The documentation of KPIs compiles both academic insights and practitioner experience in working with these performance management tools.

Furthermore, Top 25 Finance KPIs – 2020 Edition provides a complete hands-on experience in working with KPIs as it contains not only 2 pages of detailed documentation for each KPI, but also interesting articles on best practices in terms of KPI selection and documentation.”

Based on the report, below are the Top 25 finance KPIs according to five subdivisions:

Asset / Portfolio Management KPIs

  • $ Loans and investments
  • % Management expense ratio (MER)

Financial Stability KPIs

  • % Capital acquisition ratio
  • % Bad debt write-offs from gross revenue
  • $ Debt-adjusted cash flow (DACF)
  • # Defensive interval ratio (DIR)
  • # Altman Z-Score (for privately held non-manufacturing companies)
  • # Altman Z-Score

Forecast and Valuation KPIs

  • $ Shareholders funds per employee
  • $ Economic value added (EVA)
  • % Capital reinvestment ratio
  • % Accurate forecasts of planned expenditure
  • % Cash flow return on investment (CFROI)

Liquidity KPIs

  • # Cash flow adequacy ratio
  • # Debt-service coverage ratio (DSCR)

Profitability KPIs

  • # Basic earning power ratio (BEP)
  • # Labor multiplier
  • % Return on funds employed (ROFE)
  • # Capital expenditure to sales ratio
  • % Return on net assets (RONA)
  • % Return on capital employed (ROCE)
  • $ Contribution margin
  • % Return on fixed assets
  • $ Net present value (NPV)
  • % Net profit margin

You can access the comprehensive profile of each KPI as well as exclusive in-practice recommendations by downloading the report here.

50+ KPI Templates, Scorecards, and Dashboards for Measuring Business Success

October 22nd, 2021 Posted by KPIs, Research 0 thoughts on “50+ KPI Templates, Scorecards, and Dashboards for Measuring Business Success”

KPI templates are developed to help organizations find the right key performance indicators (KPI) for their business.

With over 17 years of research on KPI best practices, The KPI Institute emphasizes that KPIs and their value are defined and perceived depending on the industry, functional area, organizational focus, and public, private, or personal domain of application.

What is a KPI?

The KPI Institute defines KPI as a measurable expression for achieving the desired results in an area relevant to the evaluated entity’s activity. KPIs make objectives quantifiable, providing visibility into the performance of individuals, teams, departments, and organizations and enabling decision-makers to act on achieving the desired outcomes.

Typically, KPIs are monitored and communicated through dashboards, scorecards, and other forms of performance reports.

In performance management, a dashboard is used for monitoring data daily. It is characterized by visual representations of data that enable a fast and easy understanding of the performance status.

Measuring performance with dashboards and configuring it requires using enough KPIs, aligning KPIs across the organization, and establishing accountability. To design an effective dashboard, an organization should choose the most relevant KPIs, ensure the presence of precognitive attributes in the visuals, make the features interactive, and regularly provide updates.

A balanced scorecard is a tool in strategic planning and performance management that shows the four dimensions of an organization: financial, customer, internal processes, and learning, and growth. Some of the benefits of using a balanced scorecard are integrated strategic planning, the alignment of KPIs with strategy at all levels of an organization, and a comprehensive view of business performance.

The KPI Institute has put together KPI templates and a platform where you can download scorecards, dashboards, and other performance templates.

key performance indicators

For inquiries, email us at [email protected] or call T: +61 3 9028 2223 M: +61 4 2456 8088.

The Future of Production: Top 25 KPIs to Track for Efficiency and Quality

October 1st, 2021 Posted by Research 0 thoughts on “The Future of Production: Top 25 KPIs to Track for Efficiency and Quality”

KPIs production

Production KPIs matter now more than ever as businesses recover from the shocks brought about by the pandemic. When the global crisis slowed down production processes, companies were forced to make difficult strategic decisions.

Market shifts, movement restrictions, and material scarcities stemming from supply chain disruptions have affected several areas of the production process.

For instance, chemical manufacturers worldwide had to trim down capital and operational expenditure and shrink their operations to 40-60 percent capacity. This is due to insufficient manpower, dwindling demand, and inadequate raw material supplies, according to the data published in Manufacturing Tomorrow.

To meet contractual obligations and increase productivity, companies are encouraged to rethink their processes, explore new opportunities, and adapt to trends.

Digital connectivity is among the trends that will dominate industries as the 5G coverage worldwide continues to expand. Sustainability is also seen as a critical factor that will shape business operations and investments. The global market for green building materials is expected to grow from US$238 billion in the year 2020 to US$425.4 Billion by 2027.

Developing a new production strategy

However, the future of production is not just about the what and the why but also the how.

The potential of innovative technologies and business models can be further realized if their application is based on data-backed decisions. Such decisions help companies minimize risks, carry out relevant strategic plans, and see what works and what doesn’t.

With this, decision makers and managers should pay attention to their production KPIs, which aim to guarantee the quality of the production process, from efficiency to productivity as well as the quantity and quality of output.

The KPI Institute has released “The Top 25 Production KPIs – 2020 Extended Edition” to provide companies an international perspective on the most popular production KPIs. It is designed for organizations and professionals who want to measure the components that contribute to the successful implementation of a production strategy.

With over 100 pages, the report presents the most viewed KPIs based on the information gathered from smartKPIs.com, a database of over 20,000 documented KPIs.

You can download the “The Top 25 Production KPIs – 2020 Extended Edition” to access the profile of each KPI and learn its potential impact on your production strategy. You will also find exclusive in practice recommendations and best practices for KPI selection and documentation.

Here is an overview of the top 25 KPIs categorized into five areas:

Production Efficiency – ensures that the production locations are always running at full parameters.

  • # Units per man-hour
  • % Production capacity utilization
  • # Ideal run rate
  • # Production capacity
  • # Unused production capacity
  • # Work in progress
  • # Production lead time
  • % Downtime due to operator lack of training
  • % Unplanned downtime in production

Production Timeline – indicates all the time-related aspects of the production process.

  • % Production schedule attainment
  • % Production schedule adherence
  • % Production uptime
  • # Unit production time

Inventory – describes the amount of products on stock either from returns or demand, excluding the safety stock.

  • % Recovery yield rate of returned products
  • # Working stock
  • $ Work in progress
  • % Production delays due to raw material shortage
  • # Decoupling stock
  • % Boomerang return rate
  • # Frequency of production delays due to inventory shortages or supply delays

Maintenance – monitors the upkeep of the production plant and equipment.

  • # Production plants
  • % Machine utilization in production

Production Costs – refers to expenses implied by the production processes.

  • $ Penalties cost due to unsatisfied demand
  • $ Production costs per unit
  • $ Direct material variance

Read more about each of the KPI in “The Top 25 Production KPIs – 2020 Extended Edition.”  You can also sign up for the live online course offered by The KPI Institute to learn how to implement a KPI Measurement Framework in your organization.

For inquiries, get in touch with Cristina Mihăiloaie, Business Unit Manager – Research Division: [email protected], +61 (390) 282 223 or +40 (749) 424 517.

KPIs

KPI Library: What’s Inside the World’s Biggest Database of KPIs

September 8th, 2021 Posted by Research 0 thoughts on “KPI Library: What’s Inside the World’s Biggest Database of KPIs”

documented kpis

The KPI Institute (TKI) marks its 17th year of research on KPI best practices, with 21,264 KPIs documented on smartkpis.com to date. Smartkpis.com functions as an online KPI library built with performance cycle solutions and designed for professionals and public and private organizations who want to monitor the performance of key result areas of their business activities.

The KPI Database, a result of ongoing research activity managed by experienced performance measurement analysts, covers 25 industries and 16 functional areas, such as accounting, finance, CSR, human resources, portfolio and project management, sales, and supply chain.

More than 84,000 subscribers now enjoy access to a wide range of KPI examples that they can apply to their business environment, the global level, and even personal contexts, such as productivity and work-life balance. 

Members can find relevant KPI examples for their context, use them to design their own template, and get advice from experts about performance measurement.

They can also explore TKI’s Research Library, which virtually houses hundreds of resources and publications on performance-related research. 

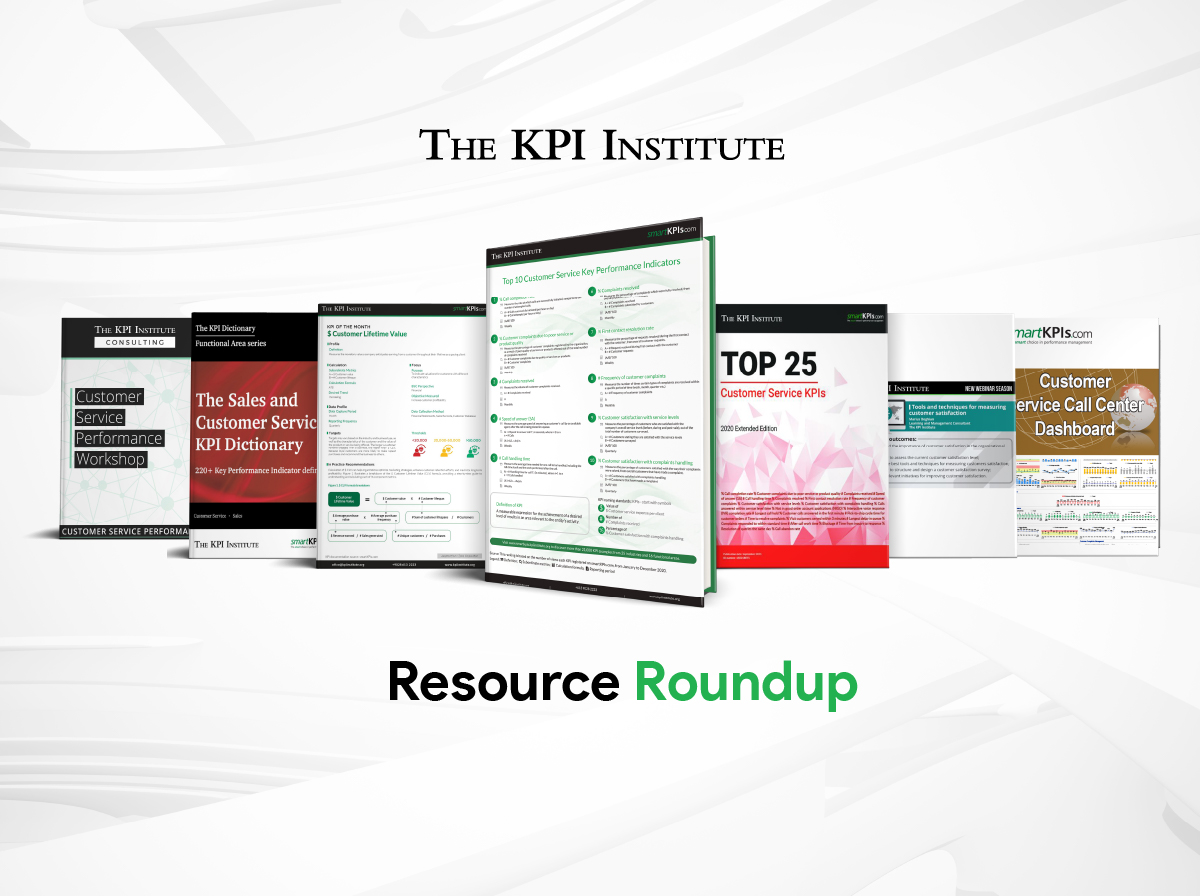
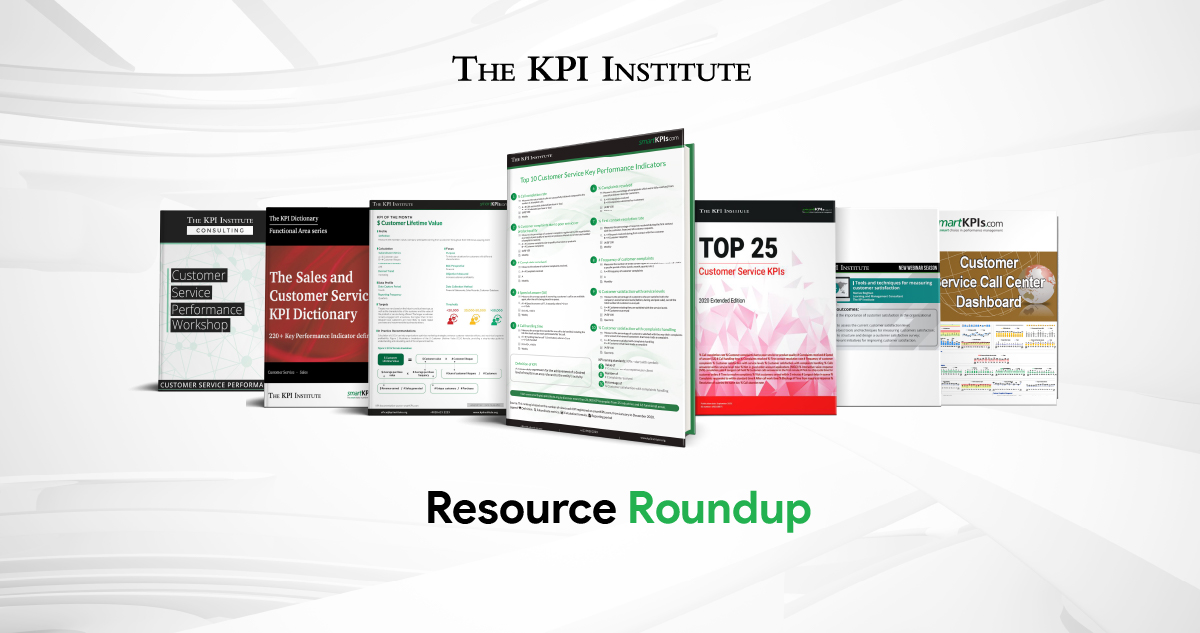
Some of them are The KPI Dictionary series, which features definitions and calculation formula for more than 8,000 KPIs, and the Top KPI Reports series, which records the most popular KPIs used in different industries along with insights from TKI’s research analysts.

To those who would like to develop and upgrade their performance management architecture, TKI offers Toolkits consisting of pre-populated templates and examples to guide organizations in the process.

Apart from generating research reports, TKI remains committed to equipping professionals and organizations with the necessary skills in addressing KPI measurement challenges. Through the Certified KPI Professional program, they can achieve international recognition in the field of performance measurement, provide value for their business, and join esteemed peers in the Certified KPI Professionals Community.

Some of the organizations that have used TKI’s services are Accenture, Microsoft, PWC, BMW, Pepsico, Samsung, Emirates, IBM, Hilton Worldwide, and Petronas. Join the growing list of clients by choosing the subscription plan that suits your needs.

For inquiries, contact Cristina Mihăiloaie, Business Unit Manager – Research Division:  [email protected], +61 (390) 282 223 or +40 (749) 424 517.

Launching our 1st grad & postgrad diploma course – the Executive Education Program experience

May 4th, 2021 Posted by Press release 0 thoughts on “Launching our 1st grad & postgrad diploma course – the Executive Education Program experience”

Promoting excellence and improving performance happens at all levels. We oftentimes focus on employees, managers, and heads of departments, but we mustn’t forget about the upper echelon – directors, and executives. They represent the starting point for an organization’s vision, mission, and overarching goals.executive

If we were to take a look at many companies, a large percentage of the reason they became and remained successful is their leadership, specifically, the people positioned at the highest ranks 

However, a number of organizations also failed precisely because the individuals at the helm did not know how to steer them in the proper direction, oftentimes swaying too much to one side or going completely off-course. 

Here at The KPI Institute, our belief is that no business should ever fail or steer off-course if it benefits from proper management. Many of our courses focus on ensuring mid-tier level or intermediate-level leaders receive the knowledge they need in order to stabilize, improve, or maximize the performance of their organization. With that said, we felt it was high time we also focused on a business’s zenith, namely its uppermost executives. 

The Executive Program in Strategy and Performance 

The Executive Program in Strategy and Performance is the most complex educational program in The KPI Institute’s portfolio.

It is designed for business leaders who are interested in strengthening their skills in strategic planning, performance measurement based on Key Performance Indicators, data analysis, and reporting, strategy execution in dynamic markets. 

The Executive Education Program is split into two parts: a postgraduate diploma course and a graduate certificate course.  

  • The Postgraduate Diploma in Strategy and Performance spans over the course of 3 semesters, or 18 months, and covers 8 specialized learning experiences. Once you’ve finished all your studies, you are required to put together a practitioner portfolio that will focus on 40 assignments. This course also awards you 280 CPD points, for your CPD development portfolio.

  • The Graduate Certificate in Strategy and Performance only lasts 2 semesters, over a period of 12 months, requiring its learners to complete 4 specialized courses and put together a practitioner portfolio that will focus on only 20 assignments. This course also awards you 140 CPD points, for your CPD development portfolio. 

Out of the 8 specialized learning experiences, 6 are mandatory, while 2 are elective. The 6 mandatory ones are Strategic Planning, Performance Measurement, Performance Management, Strategy Execution, Performance Management System Audit, and Employee Performance Management. 

The final two are up to preference. You can choose whichever two options you wish, out of the following: the Balanced Scorecard, Objectives and Key Results (OKRs), Innovation Management Framework, Data Analysis, Data Visualization, or Benchmarking. 

Admission process 

The admission process for Executive Education Program is straightforward and only has 4 steps: 

  1. You schedule an initial discussion with us, expressing your interest in this program 
  2. You submit an admission file, which will contain your letter of intent (200-500 word), your CV, and all diplomas that reflect your educational background 
  3. We will review your admission file 
  4. We will schedule an interview with you 

After the interview is concluded, we’ll look to submit a final answer on your application process in up to 3 days’ time. 

Participant profile 

This course is primarily aimed at mid-tier and high-level leaders, from sales managers, chief accountants, production supervisors, and facilities managers, to directors, presidents, vice-presidents, and CEOs.  

Our intention is to focus on business leaders who wish to better their ability to plan ahead and strategize for the future, based on present data. We cover all aspects related to business improvement, from strategy execution, data analysis, and KPI measurement, to systems thinking, project management, and performance reporting. 

Competency framework 

Each of the courses covered in this program is intended to help you expand your competencies and capabilities so that you will become an integrated strategy and performance executive. The core of our Executive Education Program courses focus on the following:  

  • The Certified Strategy and Business Planning Professional will augment your strategic planning capability, whilst improving your strategic thinking, stakeholders’ engagement, and communication competencies.

  • The Certified Agile Strategy Execution Professional will advance your strategy execution capability, whilst refining your systems thinking, project management, and leadership competencies.

  • The Certified KPI Professional will amplify your performance measurement capability, whilst developing your KPI selection, data collection, and data visualization competencies.

  • The Certified Performance Management Professional will elevate your performance improvement capability, whilst enhancing your data analysis, problem-solving, and decision-making competencies.

  • The Certified Employee Performance Management Professional will supplement and boost your knowledge on employee performance management capability, whilst progressing your employee performance planning, employee evaluation, and feedback sessions competencies.

  •  The Certified Performance Management Systems Auditor will evolve your Performance Management System maturity model based-assessment capability, whilst intensifying your examination, analytical thinking, and solutions design competencies.

Through the Executive Education Program, we aim to build a new generation of executives, one that is ready to surmount any business trials or obstacles, much like a seasoned general.

In the 21st century, it is unacceptable for a business leader to falter in the face of adversity when in this day and age, there are more tools and tricks available than ever before. 

At The KPI Institute, we believe that through knowledge, dedication, and hard work, any challenge can be overcome. Even though some hurdles are greater than others and may cause setbacks, many of the greatest success stories in history came from failure. 

It is high time we addressed the high rates of failure in strategy execution so often encountered in organizations. It is time you shape the future, by knowing exactly what needs to be done and how to generate changes in the strategy and performance management practices of your organization.

It is time to become the best version of your professional self that you can be. 

Recent Comments

    Archives